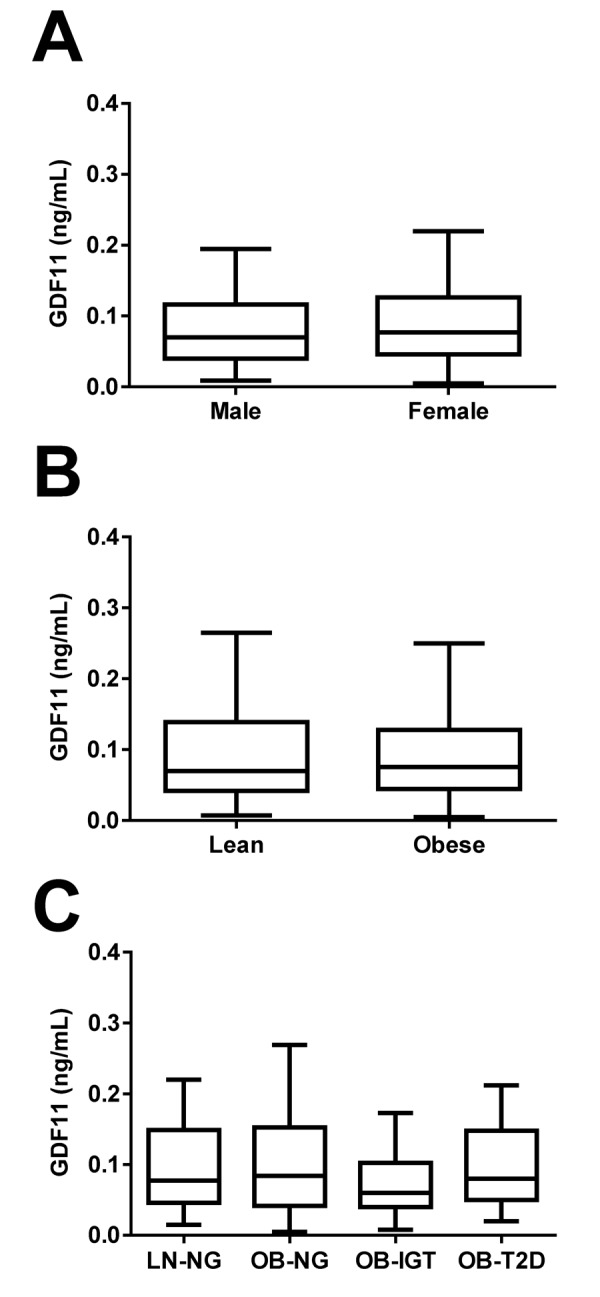
Figure 3.

Effect of gender, obesity and type 2 diabetes on GDF11 levels. (A) Comparison of serum GDF11 concentrations between males (n=126) and females (n=193). Statistical difference was analyzed by two-tailed unpaired Student’s t test. (B) Comparison of serum GDF11 concentrations between lean (n=49) and obese (n=228) individuals. Statistical difference was analyzed by two-tailed unpaired Student’s t test. (C) Serum GDF11 concentrations in the lean normoglycemic (LN-NG, n=40), obese normoglycemic (OB-NG, n=93), obese with impaired glucose tolerance (OB-IGT, n=46), and obese with type 2 diabetes (OB-T2D, n=47) groups of the whole sample. Statistical differences between groups were analyzed by one-way ANOVA. For the three figures, box represents interquartile range and median inside, with whiskers plotted according to the Tukey method.
