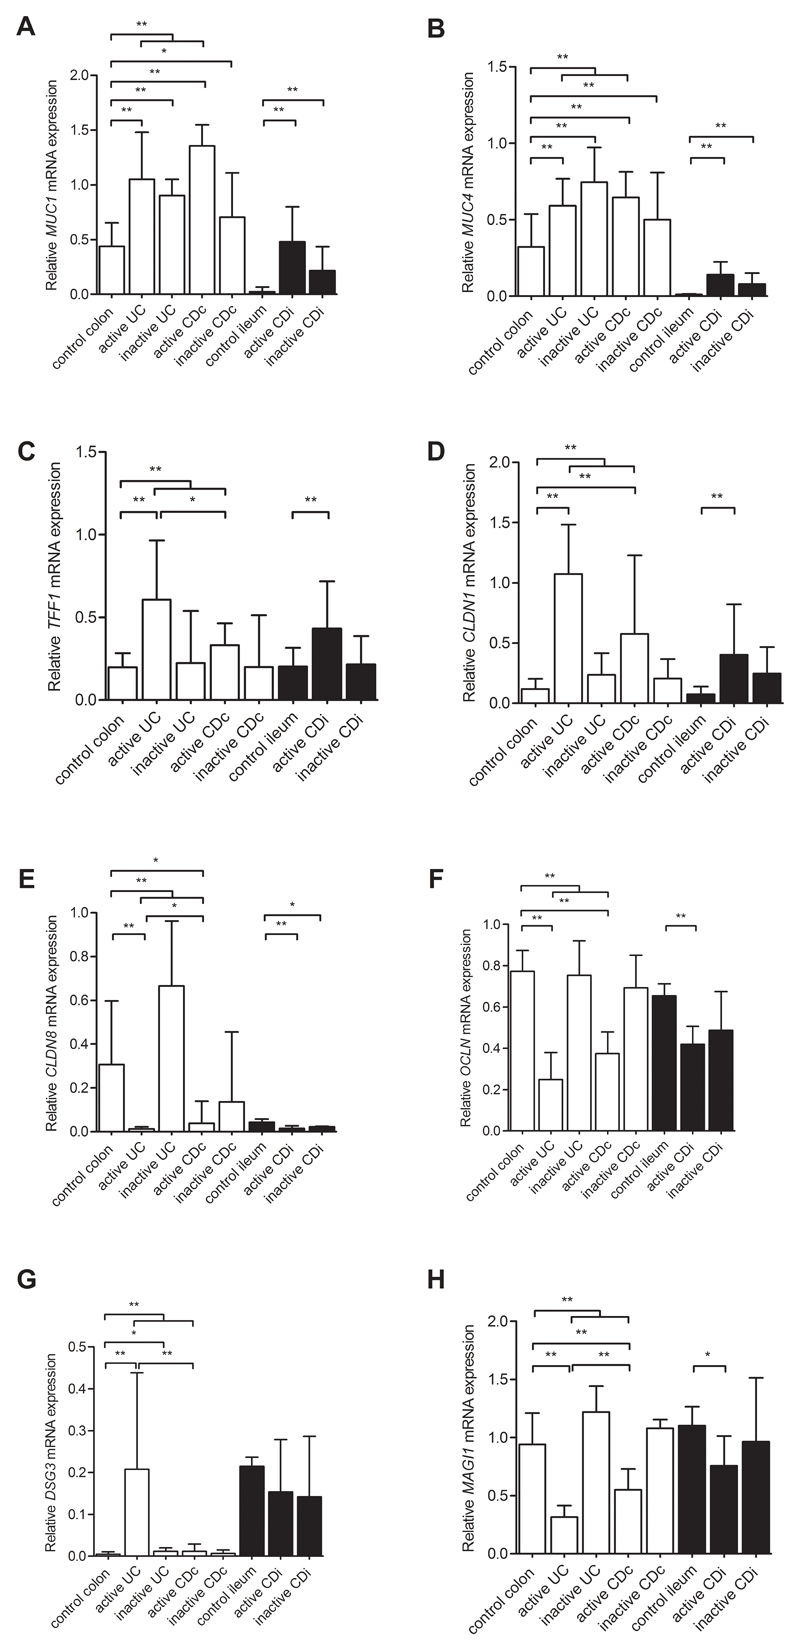
Figure 3. Relative expression levels of eight barrier genes with quantitative reverse transcription PCR.
Bar plots representing the relative expression levels of eight barrier genes (A-H) measured by qRT-PCR in colon (white bars) from controls (n=11), active UC (n=72), inactive UC (n=22), active CD patients (n=8) and inactive CD patients (n=26); and ileum (black bars) from controls (n=11), active CD (n=51) and inactive CD patients (n=14). The expression levels are normalised to beta-actin. Data are expressed as medians with interquartile range. Comparisons between the subgroups were performed with Mann-Whitney U testing. Significant differences as described in the main text are indicated (*p<0.05, **p<0.01).
UC, ulcerative colitis; CDc, colon of Crohn’s disease patients; CDi, ileum of CD patients.

