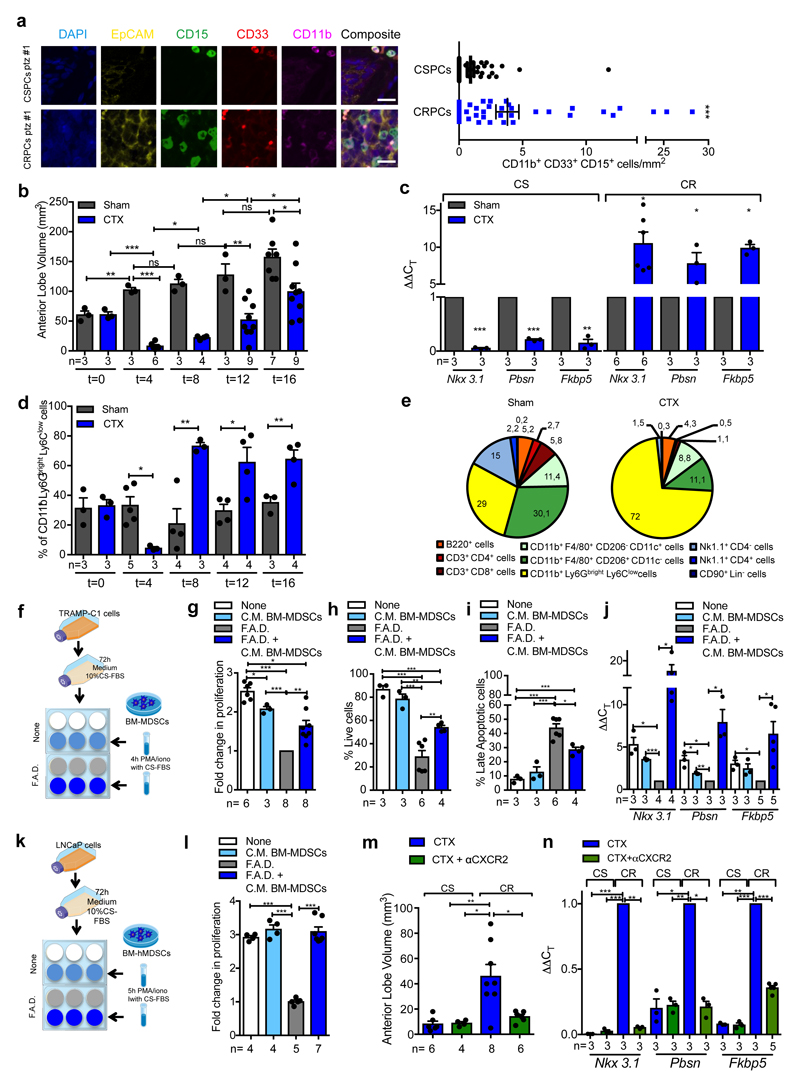
Figure 1. MDSCs infiltrate CRPC paralleling the activation of AR pathway and conferring castration resistance.
a, CD11b+ CD33+ CD15+ PMN-MDSCs within the tumors of CSPCs vs CRPCs. EpCAM yellow, CD15 green, CD33 red; CD11b pink; DAPI blue, n=51 biological independent patients per group reported as mean ± SEM. Statistical analyses (negative binomial regression model): P <0.001. b-d, Ptenpc-/- mice sham-operated (Sham) or surgically castrated (CTX) Ptenpc-/- mice at different time points. b, Tumor volume of the anterior prostate lobe. c, qRT-PCR analyses of the indicated genes in the prostate tumors at t=4 (castration sensitive phase; CS) and t=12 (castration resistance phase; CR). d, Flow cytometry for tumor PMN-MDSCs (gated on CD45+ cells). e, Percentages of tumor-infiltrating immune cell populations (gated on CD45+ cells). f, Experimental scheme. g, TRAMP-C1 cell proliferation. h, Percentage of AnnexinV and 7AAD-negative TRAMP-C1 cells. i, Percentage of AnnexinV and 7AAD-positive TRAMP-C1 cells. j, qRT-PCR analyses of the indicated genes in TRAMP-C1 cells. k, Experimental scheme. l, LNCaP cell proliferation. m, Volume of prostate tumors of CTX Ptenpc-/- mice treated or not with CXCR2 antagonist (αCXCR2) at completion of the study (12-weeks upon CTX). n, qRT-PCR analyses of the indicated genes in the prostate tumors of mice treated as in m. Specific n values of biological independent animals (b, c, d, m, n) and independent samples (g-j, l) are shown and reported as mean ± SEM. b, d, h, i, -, l, m, Statistical analyses (Unpaired two-sided t-test): ns, not significant; *P <0.05; **P <0.01; ***P <0.001. b, d, Statistical analyses (One-way ANOVA, two-sided): P <0.001. c, g, j, n, Statistical analyses (Paired two-sided t-test): *P <0.05; **P <0.01; ***P <0.001.

