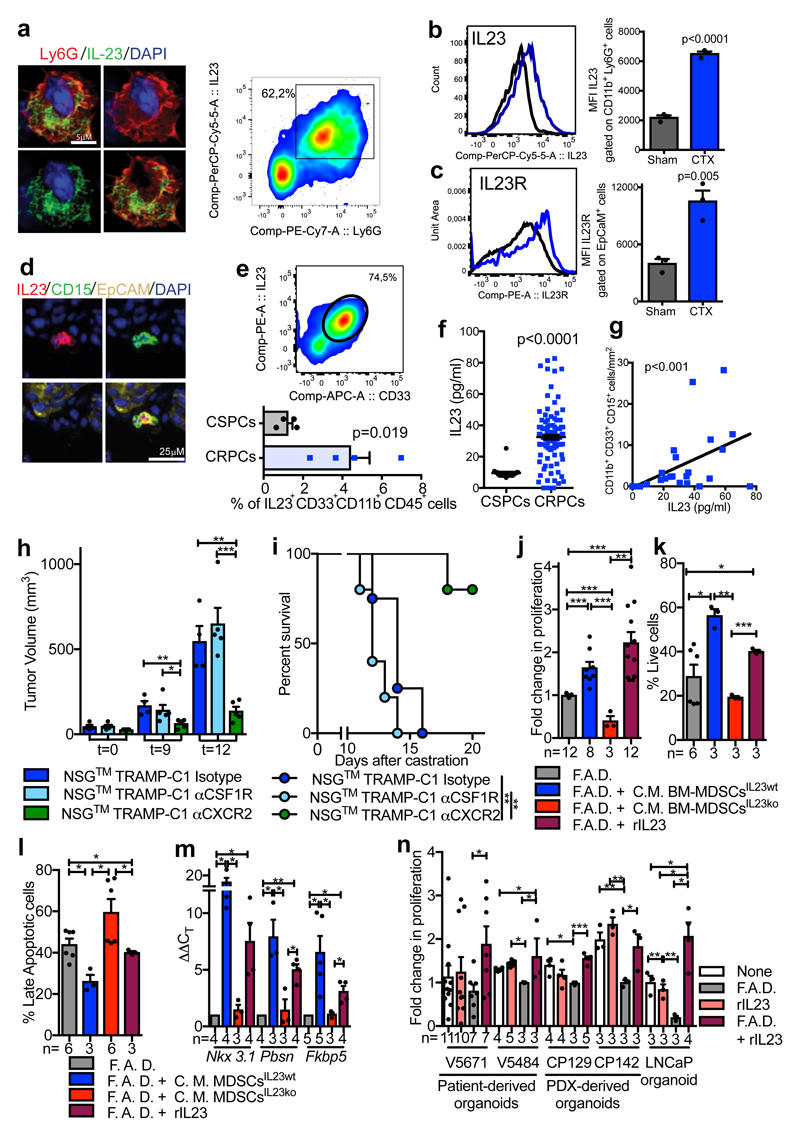
Figure 2. Tumor-infiltrating MDSCs produce IL23 that drives insensitivity to androgen deprivation.
a-c Prostate tumors from Ptenpc-/- mice Sham or CTX analyzed at t=12 a, Representative images of Ly6G+ IL23+ cells (nuclei, blue) and representative dot plot of Ly6G+ IL23+ cells gated on CD45+ cells in CTX mice. b-c, Representative histograms (left) and quantification (right; mean ± SE) showing b, Mean fluorescence intensity (MFI) of IL-23 within CD45+ CD11b+ Ly6G+ cells and c, MFI of IL-23R gated on CD45- EpCAM+ cells. b, c, n=3 biological independent animals per group. d, Representative images of IL23, CD15, EpCAM positive cells within the tumor of CRPC patients. a, d, Data were validated in at least three experiments. e, CD33+ IL23+ CD11b+ CD45+ cells within the tumor of CSPCs vs CRPCs (n=4 biological independent patients/cohort). f, IL23 levels in the plasma of CSPCs (n=20) and CRPCs (n=120) patients. g, Correlation analyses of the numbers of tumor-infiltrating PMN-MDSCs and plasmatic IL23 levels in CRPC patients (n=28). Statistical analyses (negative binomial regression model) p <0.001. h-i, Tumor progression (t=days post-castration) of NSG™ TRAMP-C1 allografts treated with Isotype control (Untreated; n=4), anti-CSF1R antibody (αCSF1R; n=5) or αCXCR2 (n=5). h, Average tumor volume. i, Survival curves reported as Kaplan-Meier plot. Statistical analyses (Log rank (Mantel-Cox) test): **P <0.01. j, TRAMP-C1 cell proliferation. k, Percentage of AnnexinV and 7AAD-negative TRAMP-C1 cells. l, Percentage of AnnexinV and 7AAD-positive TRAMP-C1 cells. m, qRT-PCR analyses of the indicated genes in TRAMP-C1 cells. n, Cell proliferation of 3D cultures of reported organoids. rIL23 conditions were normalized to the None or F.A.D. condition respectively. e,f,h,j-n, Data are reported as mean ± SE. Specific n values of biological independent samples are shown in j-n. b, c, e, f, h, j-l, n, Statistical analyses (Unpaired two-sided t-test) and m, Statistical analyses (Paired two-sided t-test), *P <0.05; **P <0.01; ***P <0.001.

