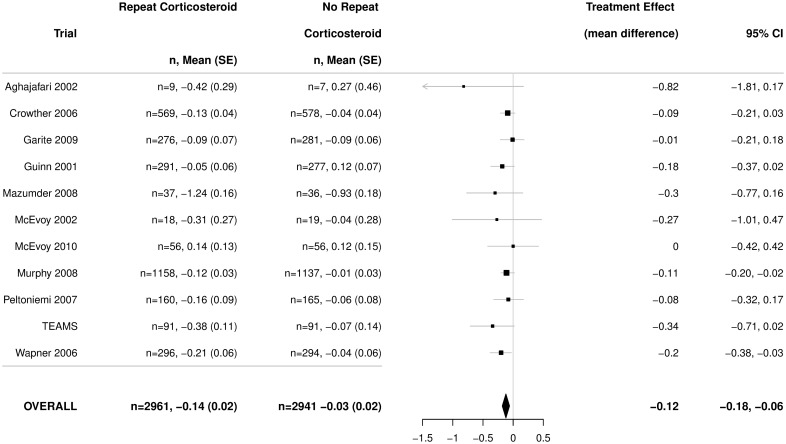
Fig 4. Primary outcome for the infant: Birth weight (z-scores).
Figures are mean and standard deviation, with adjusted mean difference as treatment effect and 95% CI. p-value for heterogeneity = 0.80. CI, confidence interval; TEAMS, Trial of the Effects of Antenatal Multiple courses of Steroids versus a single course.

