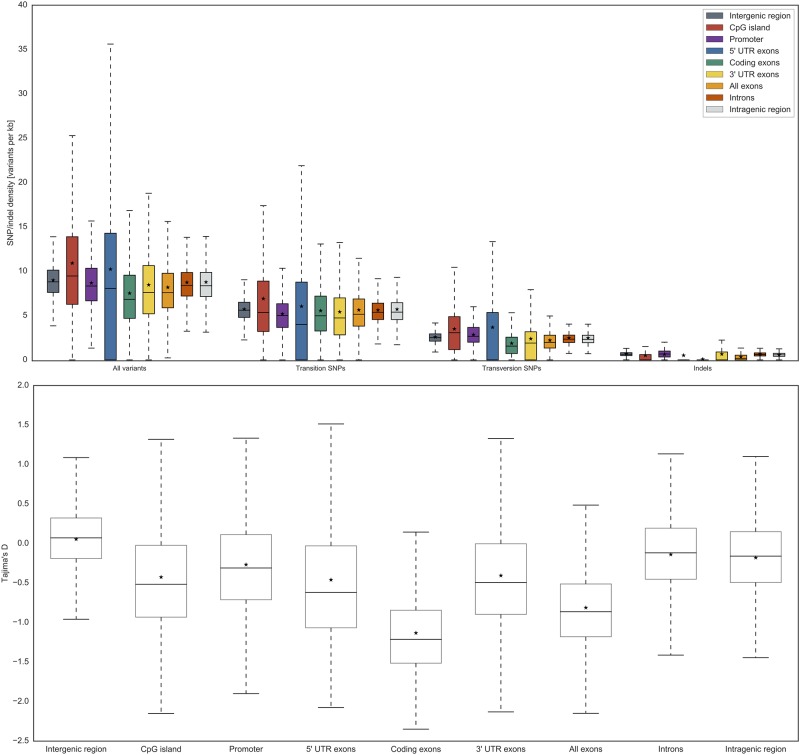
Fig 3. SNP and indel densities for all variant types and genomic elements considering 1000G data (European cohort).
Upper panel: distribution of SNP and indel densities, the horizontal line (−) represents the median value, the asterisk (⋆) denotes the mean value. In total, the 1000G European super population comprises 503 individuals; Lower panel: Tajima’s D statistic was applied to evaluate the neutral evolution hypothesis.

