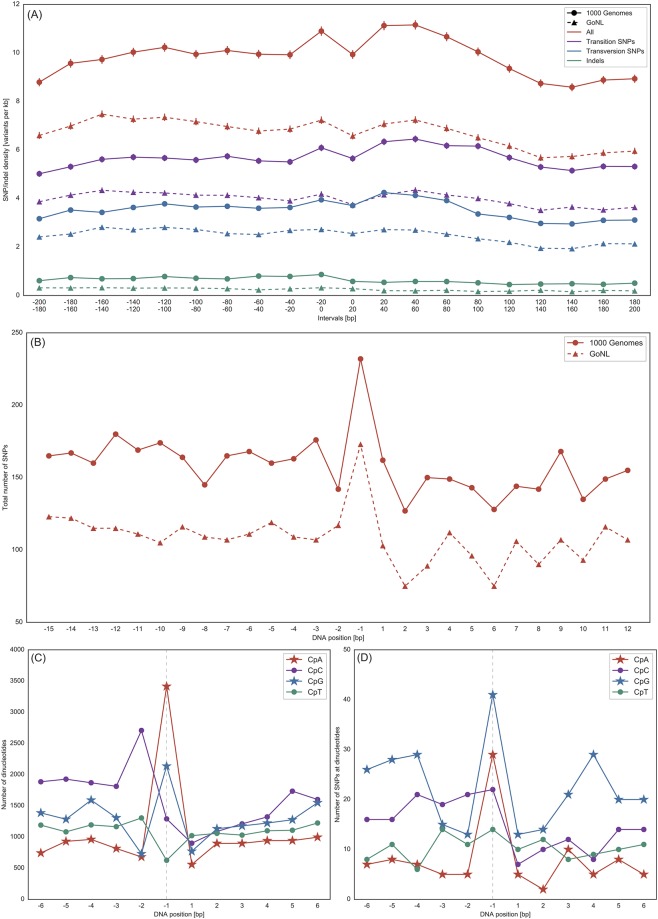
Fig 4. SNP and dinucleotide distribution around the TSS.
A: Average SNP and indel density (1000G and GoNL data) around the TSS (±200 bp) of all RefSeq genes. The standard error of the mean is visualized for every datapoint. B: SNP pattern in direct vicinity (−15 to +12) of the TSS considering 1000G and GoNL data. Position 1 denotes the first intragenic nucleotide. C: Distribution of dinucleotides starting with cytosine in the flanking region of the TSS of all RefSeq genes. CpG and CpA dinucleotides are prevalent. D: Number of SNPs (1000G data) at individual dinucleotides. The majority of SNPs resides at CpG dinucleotides.

