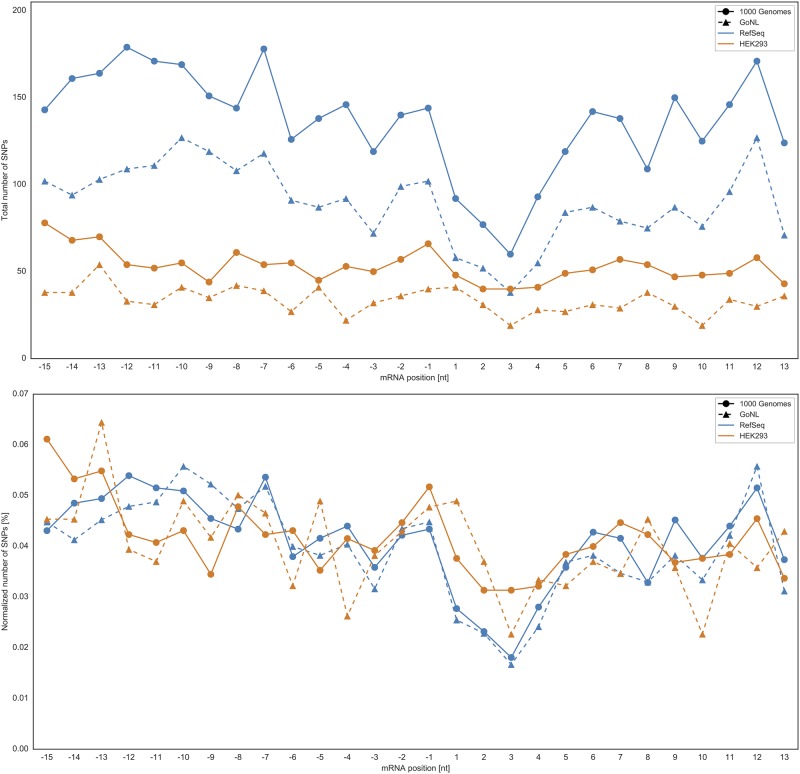
Fig 6. SNP distribution in the flanking region of the coding start site (CSS).
SNP pattern in the flanking region (–15 to +13) of canonical and alternative starts. The applied permutation test provided the following p-values (curves from top to bottom): RefSeq+1000G: 0.0, RefSeq+GoNL: 0.0002, HEK293+1000G: 0.027, HEK293+GoNL: 0.244. With a significance threshold of , the drop in the total number of SNPs at the CSS is significant only for canonical start sites. Upper panel: total number of SNPs; Lower panel: the number of SNPs normalized by the number of sequence contexts with at least one SNP, compare with Table 1.

