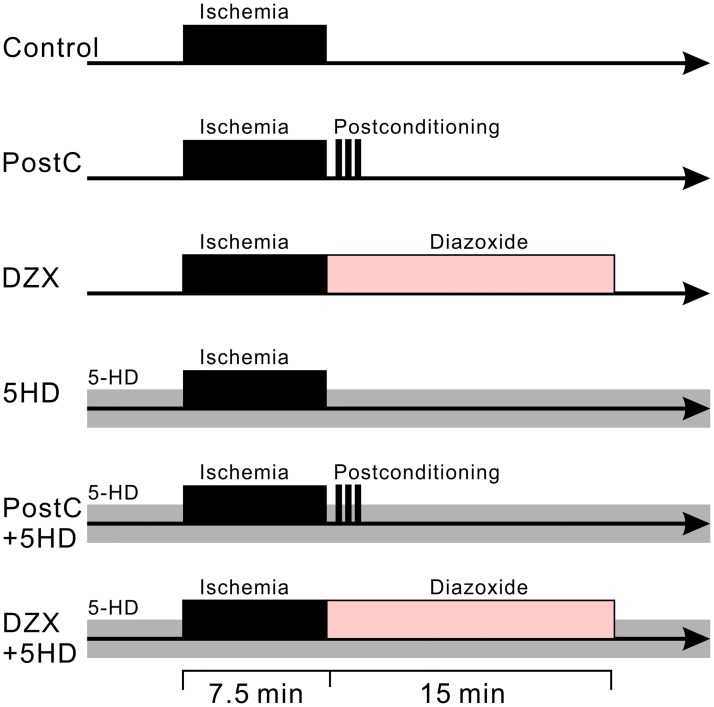
Fig 1. Diagrams representing the perfusion protocol for experimental groups.
Ischemic perfusion is shown as a black band. Gray and faded-pink bands indicate administration of 5-HD and diazoxide to the bath solution, respectively. Electrophysiological recordings started 5 min before the ischemic perfusion and lasted up to 20 min after the reperfusion.

