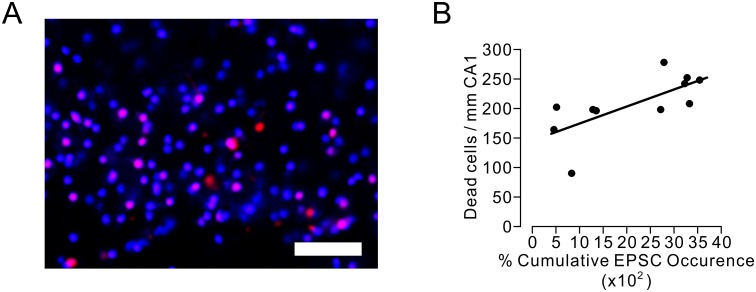
Fig 2. Correlation between cumulative EPSC occurrence and the number of cells died due to ischemic insult in hippocampal CA1 area.
A. Microscopic images of CA1 area showing nuclei of dead cells. Magenta-colored cells stained with both propidium iodide and SYTOX-blue were considered to have died before electrophysiological recording. Blue-colored cells stained with only SYTOX-blue were assumed to have died due to ischemia-reperfusion injury. Scale bars = 50 μm. B. Two-dimensional scatter plot of cumulative EPSC occurrence and dead cell number per 1 mm of CA1 area. A positive correlation between cumulative EPSC occurrence and surviving cell number was statistically significant (Pearson’s correlation coefficient r = 0.70, n = 11, Student’s t = 2.96, p = 0.016). The line represents an estimated linear regression.

