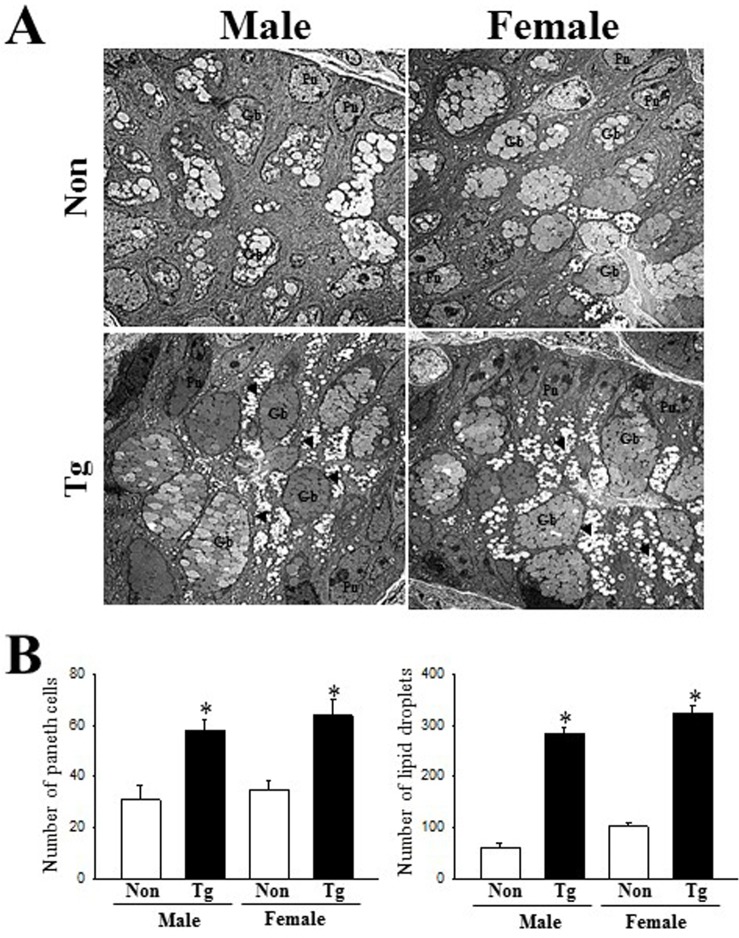
Fig 4. TEM images of colon.
(A) Ultrastructure of the crypt in the NT and Tg mice was viewed by TEM at 1800× magnification. (B) The number of Paneth cells and lipid droplets were measured in extracellular matrix using the Leica Application Suite (Leica Microsystems, Switzerland). Five or six mice per group were assayed in triplicate by TEM analysis. Data are reported as the mean ± SD. *, p<0.05 compared to the NT group. Lm, lumen of crypt; Gb, goblet cells; Pn, paneth cells; Gr, granule cells; Ld, lipid droplets; SV, Secretory vesicles.

