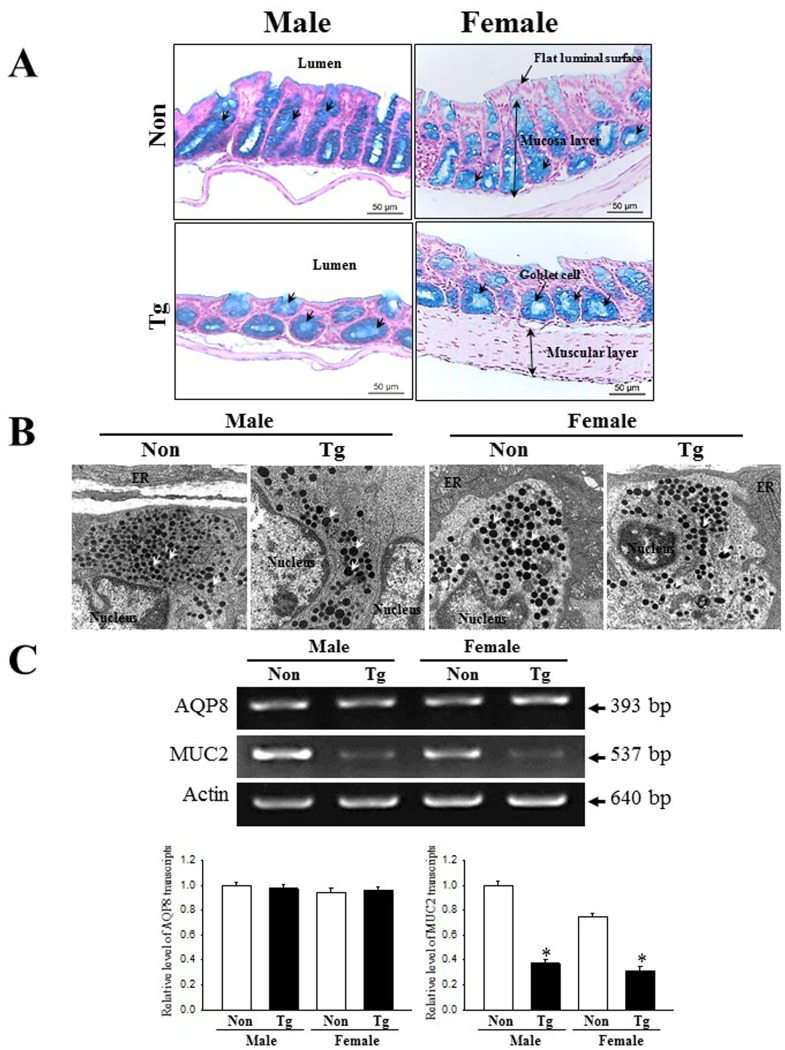
Fig 5. Detection of mucin secretion and membrane water channel expression.
(A) Mucin secreted from the crypt layer cells was stained with alcian blue at pH 2.5. Images were observed at 100× magnification. A total of 5–6 mice per group were assayed in triplicate by alcian blue staining. (B) The distribution of secretory vesicles in Paneth cells were observed by TEM at 4,000× magnification. (C) The levels of MUC2 and AQP8 transcripts in the total mRNA of colons were measured by RT-PCR using specific primers. After the intensity of each band was determined using an imaging densitometer, the relative levels of MUC2 and AQP8 mRNA were calculated based on the intensity of actin as endogenous control. Five or six mice per group were assayed in triplicate by RT-PCR assays. Data are reported as the mean ± SD. *, p<0.05 compared to the NT group.

