
Fig 2. Immunohistochemical staining for CD4+, CD8+ and Foxp3+ TILs.
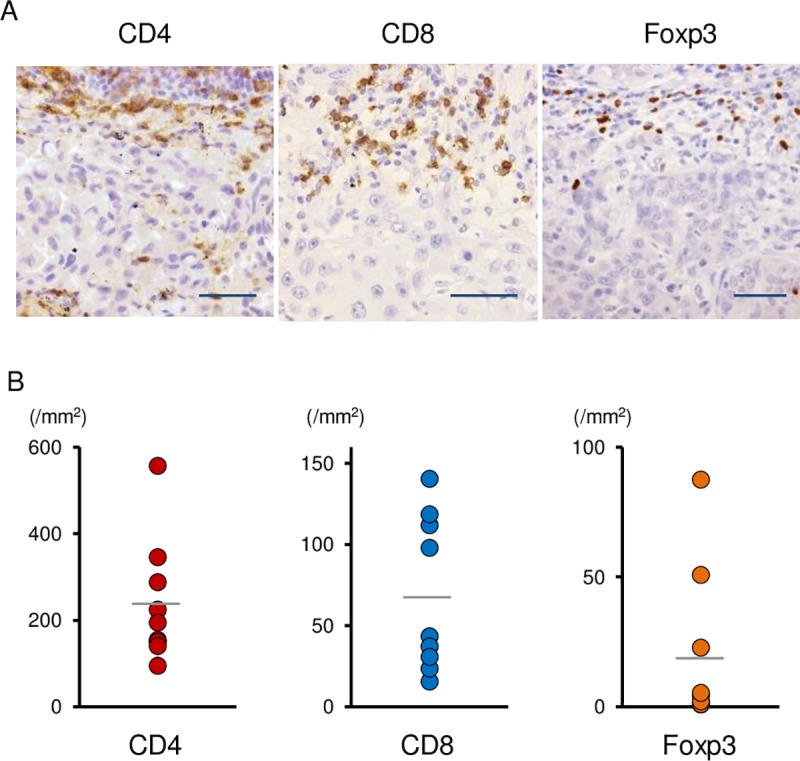
(A) Representative examples of immunohistochemical staining images (scale bar 100 μm) for CD4, CD8 and Foxp3 are shown. (B) The numbers of CD4+ TILs, CD8+ TILs and Foxp3+ TILs are shown.