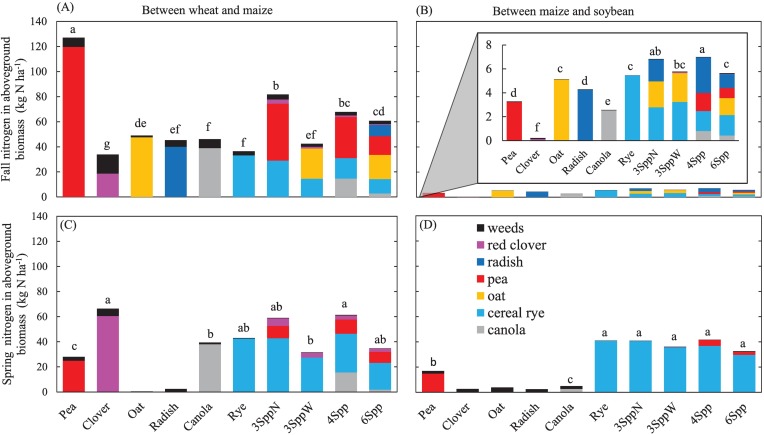
Fig 1. Nitrogen in aboveground cover crop and weed tissues.
Values are means (n = 12 replicates) across all three sampling years. Top panels (A and B) are fall biomass and bottom panels (C and D) are spring biomass. Left panels (A and C) are for the cover crop window between wheat and maize and right panels (B and D) are for the window between maize and soybeans. Panel B has an inset on a different scale because of the very low values in this sampling period. Treatments with different lowercase letters had statistically different total cover crop biomass N (Fisher’s LSD, α = 0.05). For spring data (C and D), some species did not over winter, and thus there is no cover crop biomass and no statistical significance reported, though we still plot weed biomass for reference.

