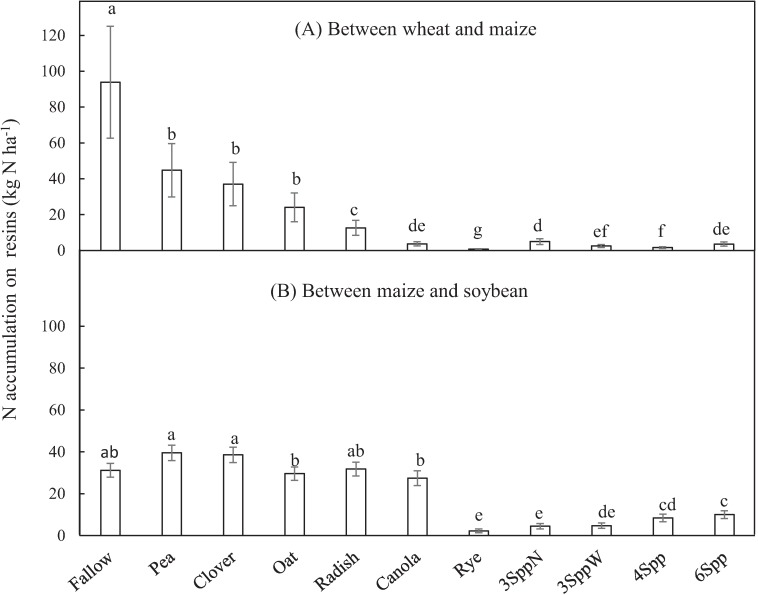
Fig 3. Nitrogen (N) accumulating on resins.
Resins buried beneath cover crop treatments planted between (A) wheat and maize or (B) between maize and soybean. Main bars are back-transformed estimated marginal means and error bars are back-transformed model standard error. Three years of data are averaged in (A) (n = 12) and 2 years for (B)(n = 8). Treatments with different lowercase letters had statistically different N accumulation on resins (Fisher’s LSD, α = 0.05).

