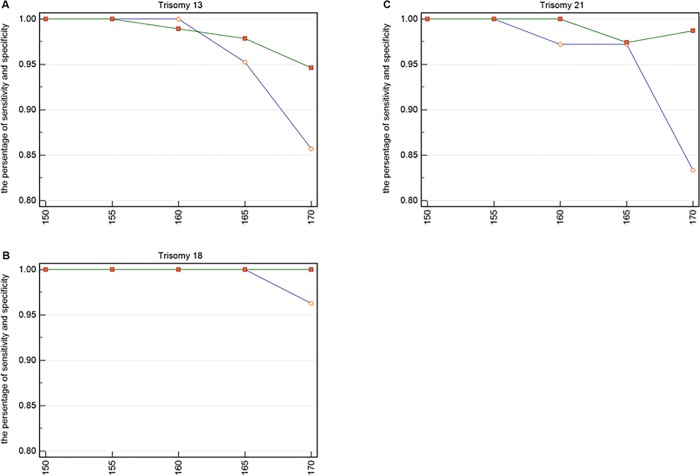
Fig 4. The specificity and sensitivity of each upper boundary for trisomy 13, 18, and 21.
(A) The specificity and sensitivity for 21 pregnancies with trisomy 13 and for 93 pregnancies without trisomy 13. The small circles represent sensitivity and the small squares represent specificity. (B) The specificity and sensitivity for 27 pregnancies with trisomy 18 and for 87 pregnancies without trisomy 18. (C) The specificity and sensitivity for 36 pregnancies with trisomy 21 and for 78 pregnancies without trisomy 21.

