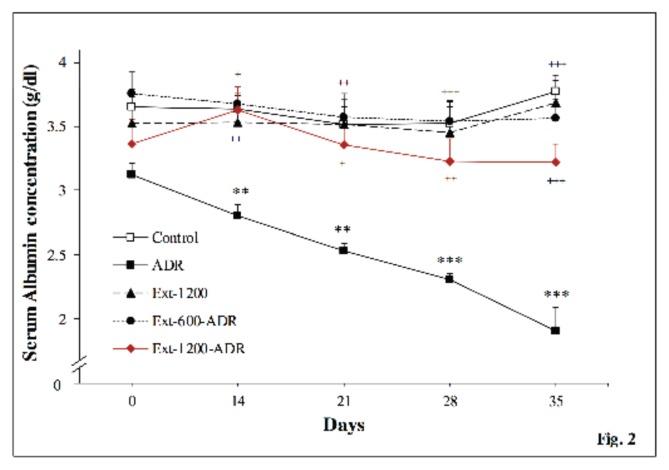
Figure 2.
Serum albumin concentration in the experimental groups. The data are shown as mean ± SEM; n = 10. **P < 0.01 ***P < 0.001 vs. control group and +P < 0.05, ++P < 0.01 +++P < 0.001 vs. ADR group at each given time point. (Main effect by two-way mixed design ANOVA: treatment: P < 0.001; time: P < 0.001; interactions: P < 0.001).

