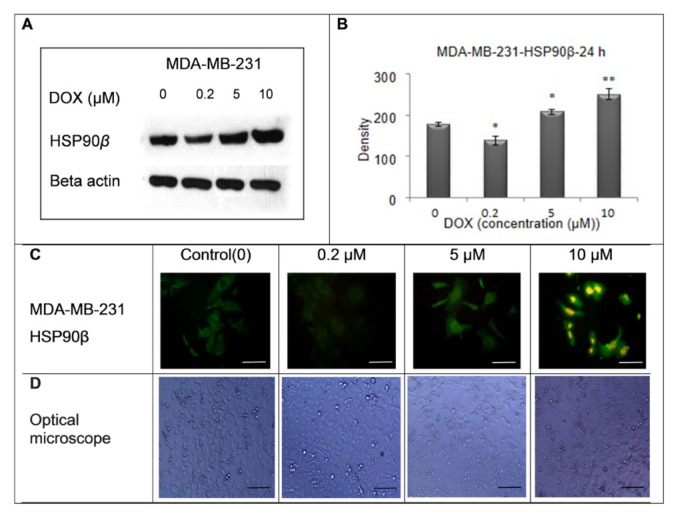
Figure 2.
These data show the expression of HSP90β before and after treatment with different concentrations of DOX (0, 0.2, 5, and 10 μM) in MDA-MB-231 cell line for 24 h. The expression of HSP90β in MDA-MB-231 cells was decreased in the concentration of 0.2 μM and increased in the concentrations of 5 and 10 μM and shows MDA-MB-231 cell density by optical microscope (x 100).The scale bar represents 100 μm.

