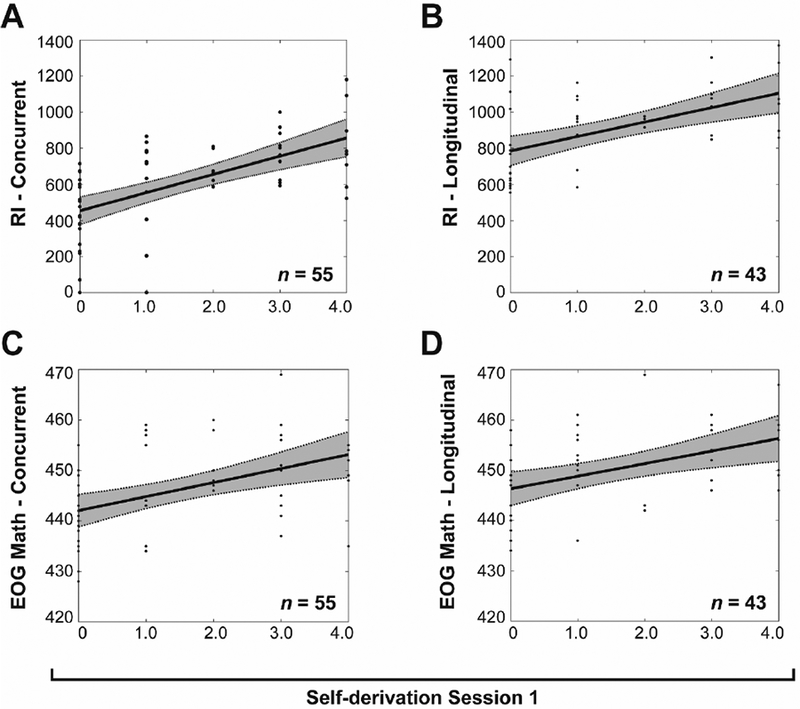
Figure 7.

Scatter plots depicting the association between self-derivation and scores on the concurrent Reading Inventory assessment (A), longitudinal Reading Inventory assessment (B), concurrent End-of-Grade math assessment (C) and longitudinal End-of-Grade math assessment (D) in children in Experiment 2.
