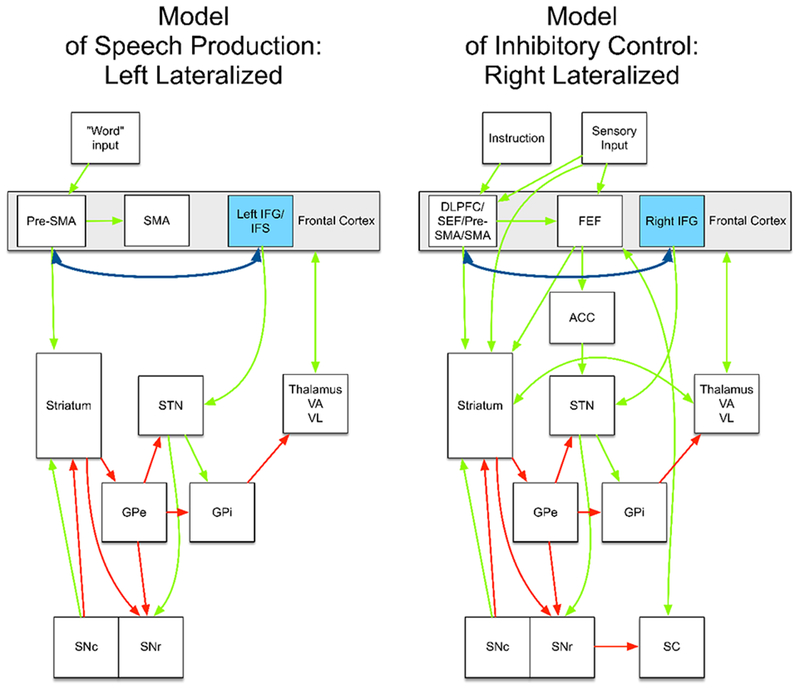
Figure 4.

Left: An example connectivity model of speech production, from Guenther (Guenther, 2016). For simplicity, the model is incomplete (e.g., it does not include the cerebellum). The complete model is specified in Guenther (2016). Right: An example connectivity model of inhibitory control, based on Wiecki and Frank (Wiecki & Frank, 2013). The dark blue double-headed arrow represents the frontal aslant tract (FAT). Pre-SMA = pre-supplementary motor area; SMA = supplementary motor area; STN = subthalamic nucleus; thalamus VA/VL = ventral anterior and ventral lateral thalamic nuclei; GPe and GPi = globus pallidus external and internal; SNc = substantia nigra, pars compacts; SNr = substantia nigra, pars reticulata. ACC = Anterior cingulate cortex. SC = superior colliculus. Green arrows indicate excitatory connections. Red arrows indicate inhibitory connections.
