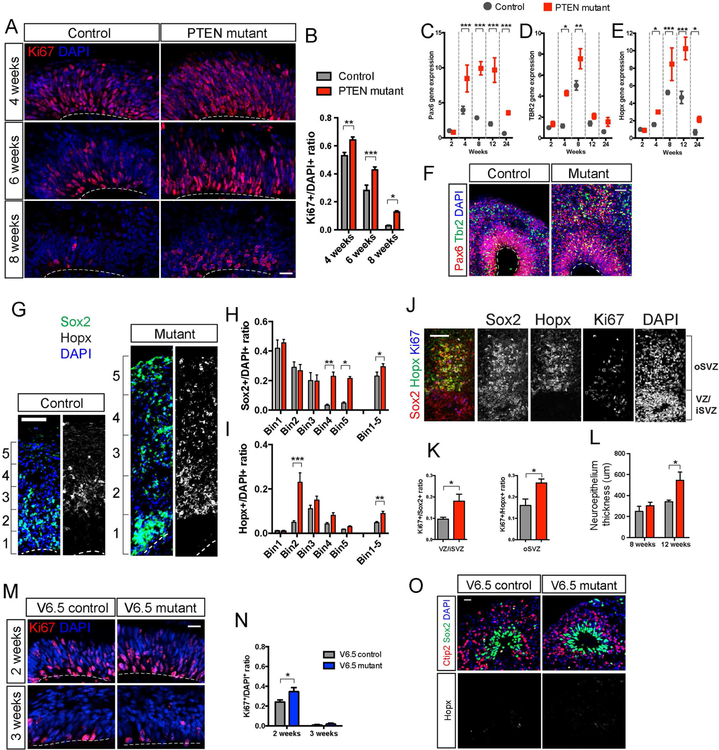
Figure 4. PTEN deletion enhances proliferation and expands the NP pool.
A-B) Representative images and quantification of Ki67 immuno-staining in control and PTEN mutant WIBR3 cerebral organoids. Scale bar, 20um.
C-E) Quantitative RT-PCR analysis of radial glial marker Pax6 (C), intermediate progenitor marker Tbr2 (D), and outer radial glia marker Hopx (E) demonstrates their temporal-specific over-expression in PTEN mutant WIBR3 organoids compared to controls.
F) Immuno-staining for Pax6 and Tbr2 shows increased number of positive cells in PTEN mutant WIBR3 organoids.
G-I) Representative images of the expanded neuroepithelium in 12-week-old control and PTEN mutant WIBR3 organoids stained with Sox2 and outer radial glia marker Hopx. Quantification was conducted by measuring and dividing the entire span of the neuroepithelium into 5 equal portions (bins), showing significantly more Sox2+ (H) and Hopx+ cells (I) in PTEN mutant WIBR3 organoids in the expanded neuroepithelium. Scale bar, 100um.
J-K) Representative images of Sox2, Hopx, Ki67 co-staining in a PTEN mutant WIBR3 organoid (J), and quantification showing increased proliferation of VZ/iSVZ as well as oSVZ NPs in PTEN mutants compared to controls.
L) Total neuroepithelial thickness at 8 and 12 weeks in control and PTEN mutant WIBR3 organoids.
M-N) Representative images and quantification of Ki67 immuno-staining in control and Pten mutant mouse cerebral organoids. Scale bar, 20um.
O) Immuno-staining for NP marker Sox2, outer radial glia marker Hopx, and neuronal marker Ctip2 in 3-week-old control and Pten mutant mouse organoids, showing lack of Hopx immuno-positivity. Scale bar, 20um.
Results are mean +/− SEM. *p<0.05, **p<0.01, ***p<0.001. See also Figure S5.

