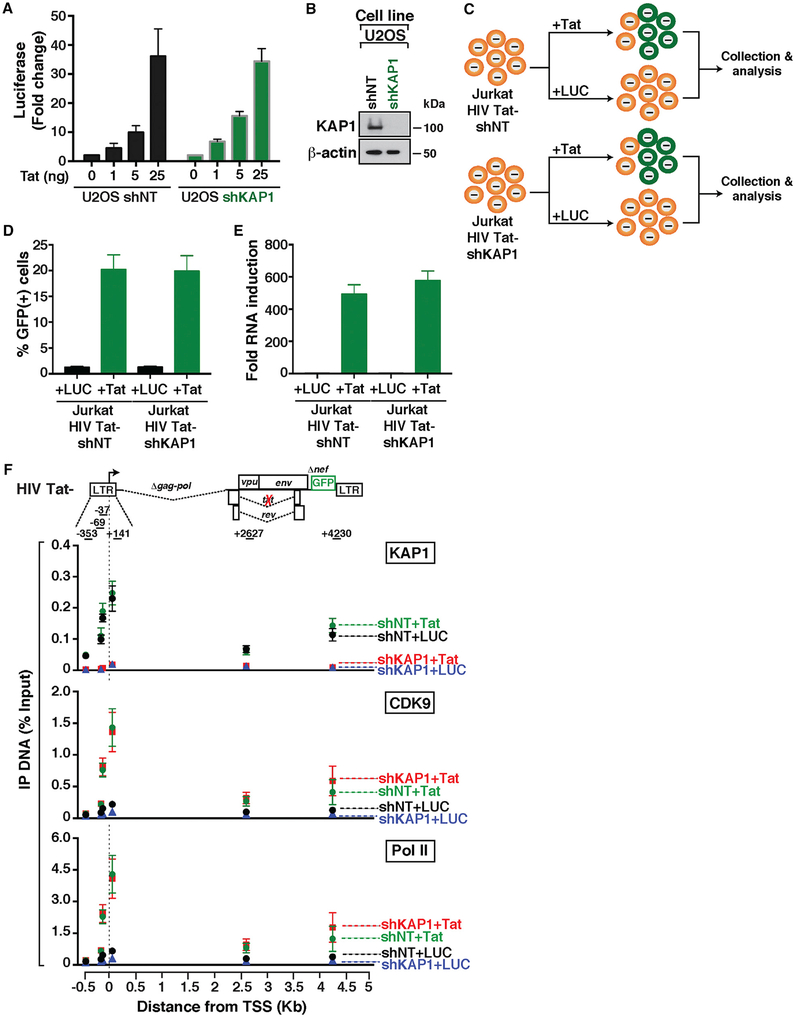
Figure 5. The Master Regulator of the Viral Phase Operates in a KAP1-Independent Manner.
(A) Quantification of luciferase activity (FFL) from an HIV reporter in the absence (0) or presence of increasing Tat (normalized to CMV-RL).
(B) Western blots of the indicated cell lines used in (A).
(C) Experimental outline in which the HIV Tat− shNT and shKAP1 cell lines were transduced with pTRIP-luciferase (LUC) or pTRIP-Tat at day 1 and collected at day 3 for their subsequent analysis.
(D) Flow cytometry-based quantitation of the percentage of GFP+ cells after transduction of the cell lines from (C) with the indicated lentiviruses.
(E) Real-time qPCR assay of RNA isolated from the indicated cell lines using the elongation amplicon (+2627). The change in HIV gene expression is shown as fold RNA induction (Tat over LUC).
(F) Top: scheme of HIV Tat. The arrow denotes the position of the TSS. Bottom: ChIP assays were performed with protein extracts from the four cells states from (C) and the indicated antibodies followed by qPCR with a series of amplicons mapping throughout the entire provirus to monitor factor interactions with the HIV genome. Values represent the percentage of input DNA immunoprecipitated (IP DNA).
For all the experiments in this figure, values plotted represent the average of three independent experiments (mean ± SEM; n = 3).

