. 2019 Mar 26;8:e43996. doi: 10.7554/eLife.43996

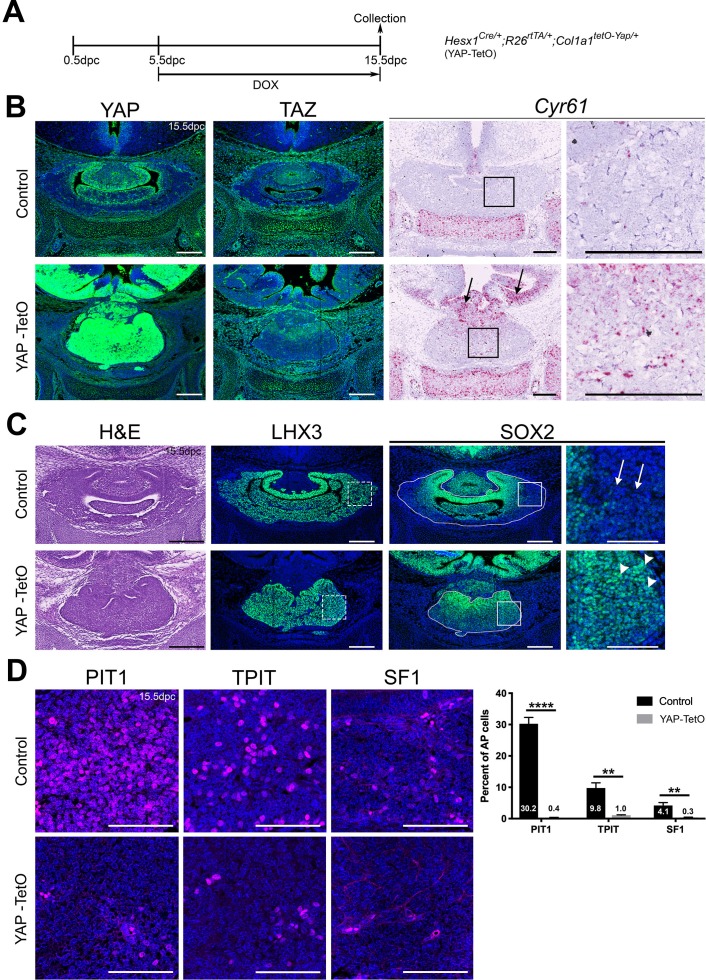
Figure 1. Regulation of YAP is required for normal morphogenesis and lineage commitment during pituitary development.

(A) Schematic outlining the time course of doxycycline (DOX) treatment administered to pregnant dams from Hesx1Cre/+ x R26rtTA/rtTA;Col1a1tetO-Yap/tetO-Yap crosses for the embryonic induction of YAP(S127A) expression in Hesx1Cre/+;R26rtTA/+;Col1a1tetO-Yap/+ (YAP-TetO) mutant embryos as well as controls that do not express YAP(S127A) (Hesx1+/+;R26rtTA/+;Col1a1tetO-Yap/+ controls shown here). (B) Immunofluorescence staining against YAP and TAZ on frontal pituitary sections at 15.5dpc confirms accumulation of YAP protein in YAP-TetO compared to control sections, but no increase in TAZ levels. RNAscope mRNA in situ hybridisation against the YAP/TAZ target Cyr61 confirms an increase in transcripts in the anterior pituitary as well as the hypothalamus where the Cre is also active (arrows). (C) Haematoxylin and eosin staining of frontal pituitary sections from 15.5dpc control and YAP-TetO embryos showing pituitary dysmorphology in mutants. Immunofluorescence staining for LHX3 to mark anterior pituitary tissue and SOX2 to mark pituitary progenitors shows the persistence of SOX2 protein in lateral regions of the gland in YAP-TetO mutants (arrowheads) when they have lost SOX2 expression in controls (arrows) (magnified boxed region in SOX2, corresponding to dashed box in LHX3). (D) Immunofluorescence staining for lineage-committed progenitor markers PIT1, TPIT and SF1 reveals very few cells expressing commitment markers in YAP-TetO compared to control. Graph showing quantification of committed cells of the three anterior pituitary endocrine lineages, positive for PIT1, TPIT and SF1, as a percentage of total nuclei of Hesx1+/+;R26rtTA/+;Col1a1tetO-Yap/+ control and Hesx1Cre/+;R26rtTA/+;Col1a1tetO-Yap/+ (YAP-TetO) mutant pituitaries at 15.5dpc (Student’s t-test; PIT1: p<0.0001 (****), TPIT: p=0.0012 (**), SF1: p=0.0021 (**)). Scale bars 100 µm, 50 µm in magnified boxed regions in C. See also Figure 1—figure supplements 1 and 2.

Figure 1.

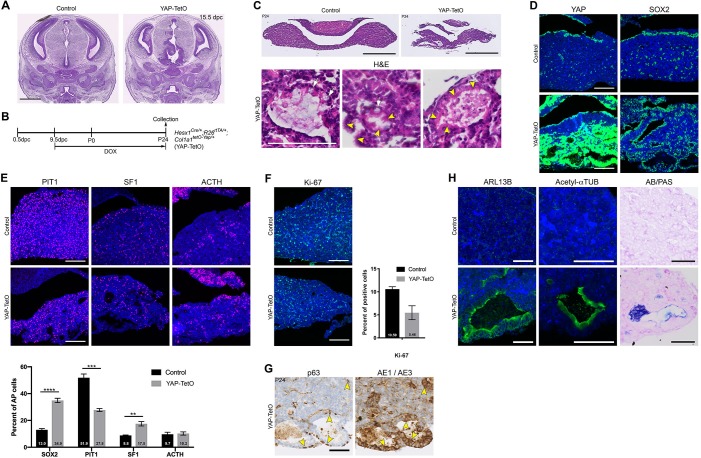
Figure 1—figure supplement 1. Regulation of YAP and TAZ during pituitary development.

Figure 1—figure supplement 1.

(A) Hematoxylin and eosin staining on frontal sections through the pituitary from control and YAP-TetO heads after DOX treatment from 5.5dpc until 15.5dpc. (B) Schematic outlining the time course of doxycycline (DOX) treatment administered to Hesx1Cre/+;R26rtTA/+;Col1a1tetO-Yap/+ (YAP-TetO) and Hesx1+/+;R26rtTA/+;Col1a1tetO-Yap/+ controls to drive expression of YAP-S127A in mutant pituitaries during embryonic as well as postnatal development. (C) Hematoxylin and eosin (H and E) staining of control and YAP-TetO pituitaries at P24. Higher magnification images show the presence of cysts in the YAP-TetO mutant. White arrows indicate cells with enlarged nuclei surrounding the cysts and yellow arrowheads indicate ciliated cells. (D) Immunofluorescence staining against total YAP on frontal sections at P24 confirms accumulation of YAP protein in YAP-TetO compared to control sections, especially in the ventral anterior lobe. Immunofluorescence staining against SOX2 shows an expansion of SOX2+ epithelia lining cysts. (E) Immunofluorescence staining for lineage-committed progenitor markers PIT1, SF1 and of ACTH marking cells of the TPIT lineage in control and YAP-TetO sections at P24. The number of SOX2+ and lineage-committed cells is quantified in the graph below. Note there is a significant increase in the proportion of SOX2+ cells in YAP-TetO mutants (Student’s t-test, p<0.0001 (****)), decrease in PIT1+ cells (Student’s t-test, p<0.0002 (***)), increase in SF1+ cells (Student’s t-test, p<0.0066 (**)) and no significant change in ACTH+ cells. (F) Immunofluorescence staining against Ki-67 marking cycling cells in control and YAP-TetO sections at P24. Graph showing the percentage of Ki-67+ cells across total anterior pituitary cells. There is a trend towards a reduction in the proportion of cycling cells in YAP-TetO mutants, which is not significant (Student’s t-test, p>0.05). (G) Immunohistochemistry using antibodies against p63 and the AE1/AE3 cytokeratin cocktail in YAP-TetO mutants at P24 revealing positive cells lining the cysts (arrowheads). (H) Immunofluorescence staining using antibodies against ARL13B and Acetylated α-Tubulin, staining components of cilia, reveals ciliated cells lining the cysts. Staining for Alcian Blue and Period Acid Schiff (AB/PAS) to differentiate between acidic and neutral mucins reveals royal blue-stained mucous cells lining the cysts. Scale bars 1 mm in A, 500 µm in C and 100 µm in magnified panels in C, 100 µm in D, E, F and 50 µm in G and H.
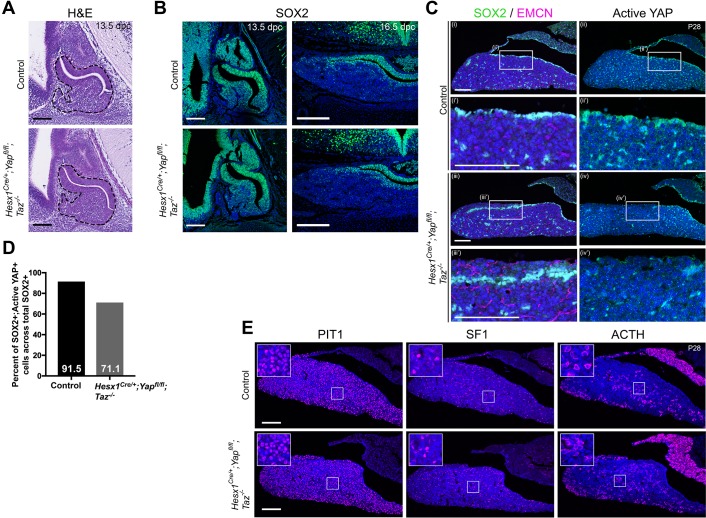
Figure 1—figure supplement 2. Regulation of YAP and TAZ during pituitary development.

Figure 1—figure supplement 2.

(A) Hematoxylin and eosin staining on sagittal pituitary sections of 13.5dpc Hesx1Cre/+;Yapfl/fl;Taz-/- (mutant) and Hesx1+/+;Yapfl/+;Taz+/- (control) showing comparable morphology. (B) Immunofluorescence staining using antibodies against SOX2 in Hesx1Cre/+;Yapfl/fl;Taz-/- and control at 13.5dpc (sagittal) and 16.5dpc (frontal) showing the presence of SOX2+ cells in both genotypes. (C) Immunofluorescence staining for SOX2, Endomucin (EMCN) and active YAP in P28 Hesx1Cre/+;Yapfl/fl;Taz-/- and control pituitaries, identifies SOX2+ cells in regions that are negative for active YAP (mice are null for TAZ) and reveals normal vasculature. (D) Graph quantifying the percentage of SOX2+ cells expressing active YAP in control and Hesx1Cre/+;Yapfl/fl;Taz-/- mutant pituitaries at P28. There is a reduction in double-positive cells in the mutant, which did not reach significance. (E) Immunofluorescence staining for lineage committed progenitor markers PIT1 and SF1, as well as ACTH marking corticotrophs (TPIT lineage), reveals the presence and normal localisation of cells from the three lineages in a P28 Hesx1Cre/+;Yapfl/fl;Taz-/- mutant. Scale bars 100 µm.