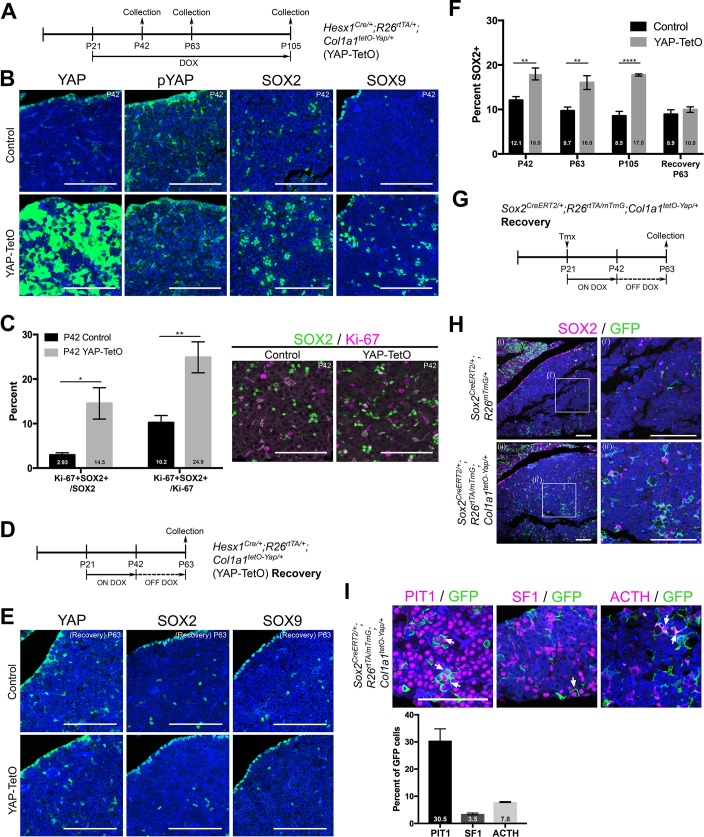
Figure 5. Postnatal expression of constitutively active YAP increases leads to an activation of SOX2+ pituitary stem cells.
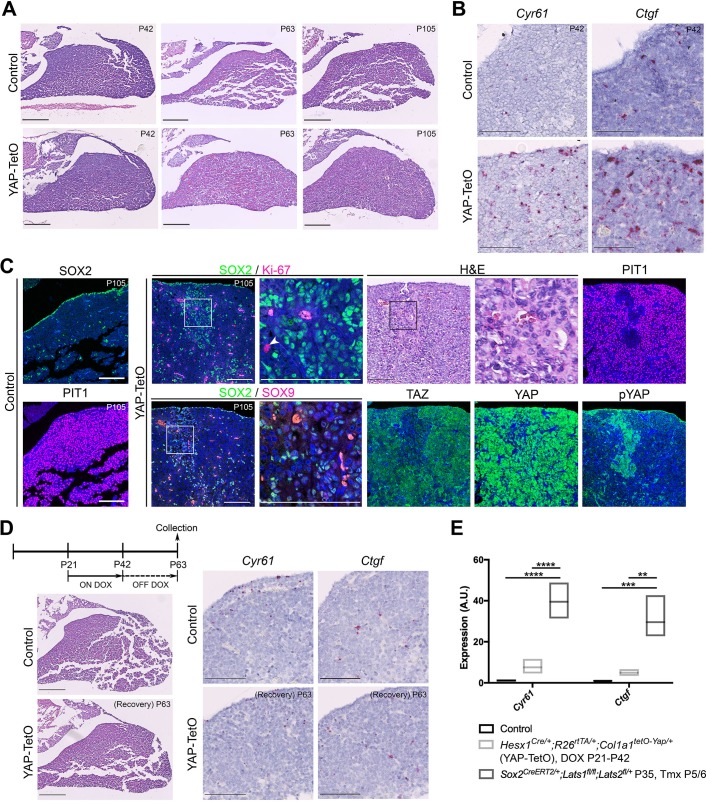
(A) Schematic outlining the time course of doxycycline (DOX) treatment administered to Hesx1Cre/+;R26rtTA/+;Col1a1tetO-Yap/+ (YAP-TetO) and Hesx1+/+;R26rtTA/+;Col1a1tetO-Yap/+ controls to drive expression of YAP-S127A in mutant pituitaries. (B) At P42 (3 weeks of treatment), immunofluorescence staining on frontal anterior pituitary sections detects strong total YAP expression in YAP-TetO mutants compared to the control and no increase in pYAP(S127). Immunofluorescence for SOX2 and SOX9 reveals an expanded population of stem cells in YAP-TetO compared to control (quantification in F). (C) Graph showing the percentage of double Ki-67+;SOX2+ cells as a proportion of the total SOX2+ (p=0.027 (*)) or Ki-67+ (p=0.006 (**)) populations at P42 (n = 3 pituitaries per genotype). There is an increase in the numbers of cycling SOX2 cells in YAP-TetO mutant compared to controls. The image shows a representative example of double immunofluorescence staining against Ki-67 and SOX2 in a control and YAP-TetO section. (D) Schematic outlining the time course of doxycycline (DOX) treatment administered to Hesx1Cre/+;R26rtTA/+;Col1a1tetO-Yap/+ (YAP-TetO) and Hesx1+/+;R26rtTA/+;Col1a1tetO-Yap/+ controls to drive expression of YAP-S127A in mutant pituitaries for three weeks, followed by a three-week recovery period in the absence of DOX. (E) Immunofluorescence staining against YAP, SOX2 and SOX9 on control and YAP-TetO pituitaries treated as in D, shows comparable expression of YAP, SOX2 and SOX9 between genotypes. (F) Graph of quantification of SOX2+ cells as a percentage of total nuclei in control and YAP-TetO pituitaries at P42 p=0.0014 (**); P63 p=0.0044 (**); P105 p<0.0001(****) (n = 3 pituitaries per genotype). Following the Recovery treatment scheme in D, there is no significant difference in the numbers of SOX2+ cells between genotypes. (G) Schematic outlining the time course of tamoxifen induction and doxycycline (DOX) treatment administered to Sox2CreERT2/+;R26rtTA/mTmG;Col1a1tetO-Yap/+ (mutant) and Sox2CreERT2/+;R26mTmG/+;Col1a1+/+ (control) animals to drive expression of YAP-S127A in SOX2+ cells of mutants. (H) Lineage tracing of SOX2+ cells and immunofluorescence staining against SOX2 and GFP shows an expansion of GFP+ cells compared to controls at P63, where a proportion of cells are double-labelled. (I) Immunofluorescence staining against commitment markers PIT1, SF1 and terminal differentiation marker ACTH (TPIT lineage) together with antibodies against GFP detects double-labelled cells (arrows) across all three lineages in Sox2CreERT2/+;R26rtTA/mTmG;Col1a1tetO-Yap/+ pituitaries following the recovery period. Graph of quantification of GFP+;PIT1+, GFP+;SF1+ and GFP+;ACTH+ cells as a percentage of total GFP+ cells in Sox2CreERT2/+;R26rtTA/mTmG;Col1a1tetO-Yap/+ pituitaries at P63. Scale bars 100 µm. Data in C. and F. represented as mean ±SEM, analysed with Two-Way ANOVA with Sidak’s multiple comparisons. See also Figure 5—figure supplement 1.


