
Fig. 1.
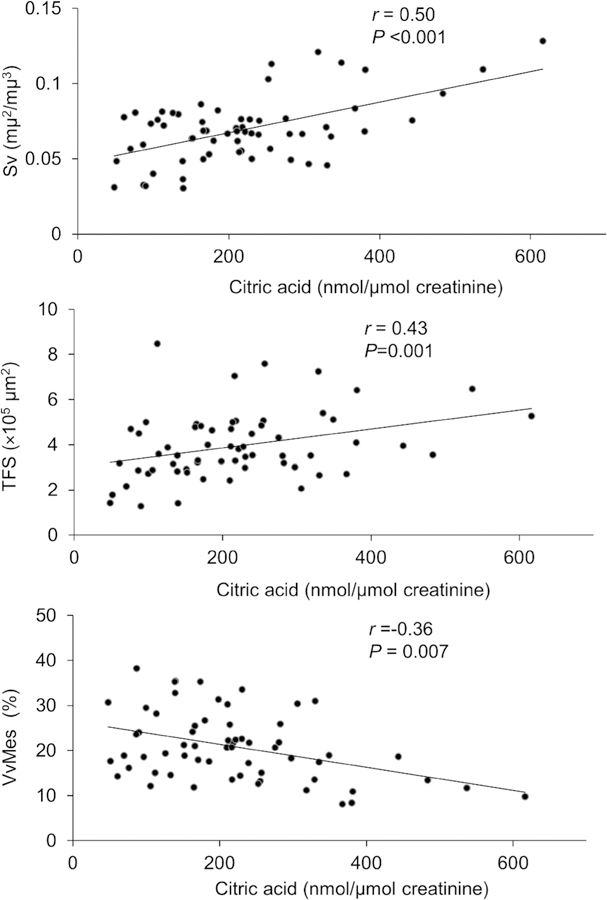
Partial regression residual plot of the associations between urine citric acid and morphometric variables. The residuals were computed from regressing each of these variables on age, sex, diabetes duration, hemoglobin A1c, mean arterial pressure, GFR, and treatment assignment. Pearson’s partial r and the corresponding P value are shown. Abbreviations: Sv glomerular filtration surface density, VvMes mesangial fractional volume, TFS total filtration surface per glomerulus