
Figure 3.
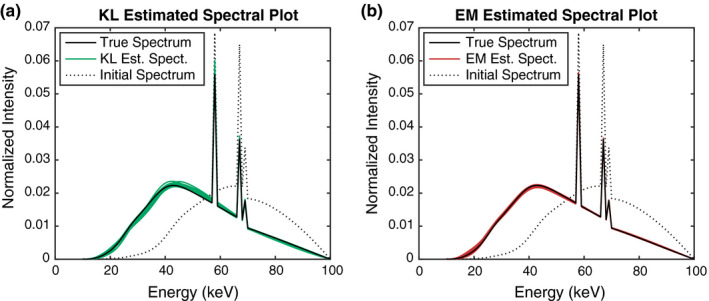
Comparison of spectrum estimation from simulated transmission measurements by use of KL and EM. Results for spectral curves, fitted by KL and EM, respectively, are displayed for 20 different trials. [Color figure can be viewed at wileyonlinelibrary.com]