
Figure 5.
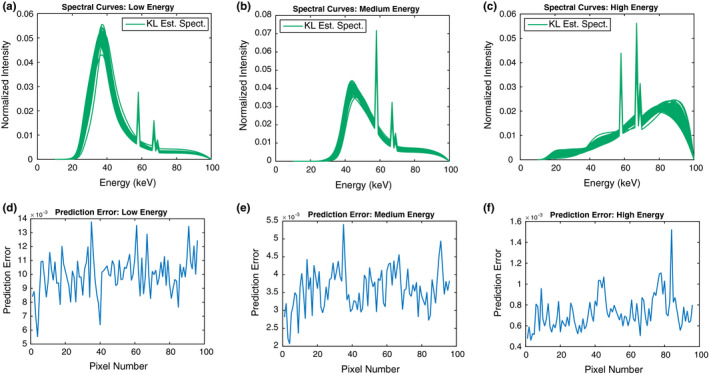
Spectrum estimation from the measured transmission data by use of KL. Each column represents the results for different spectral windows. (a, b, and c) Spectral curves for each energy window. The plots show the solution curves for 96 different detector pixels. (d, e, and f) Prediction error in the transmission curves derived from the x‐ray spectra shown above across detector pixels. [Color figure can be viewed at wileyonlinelibrary.com]