Figure 3.
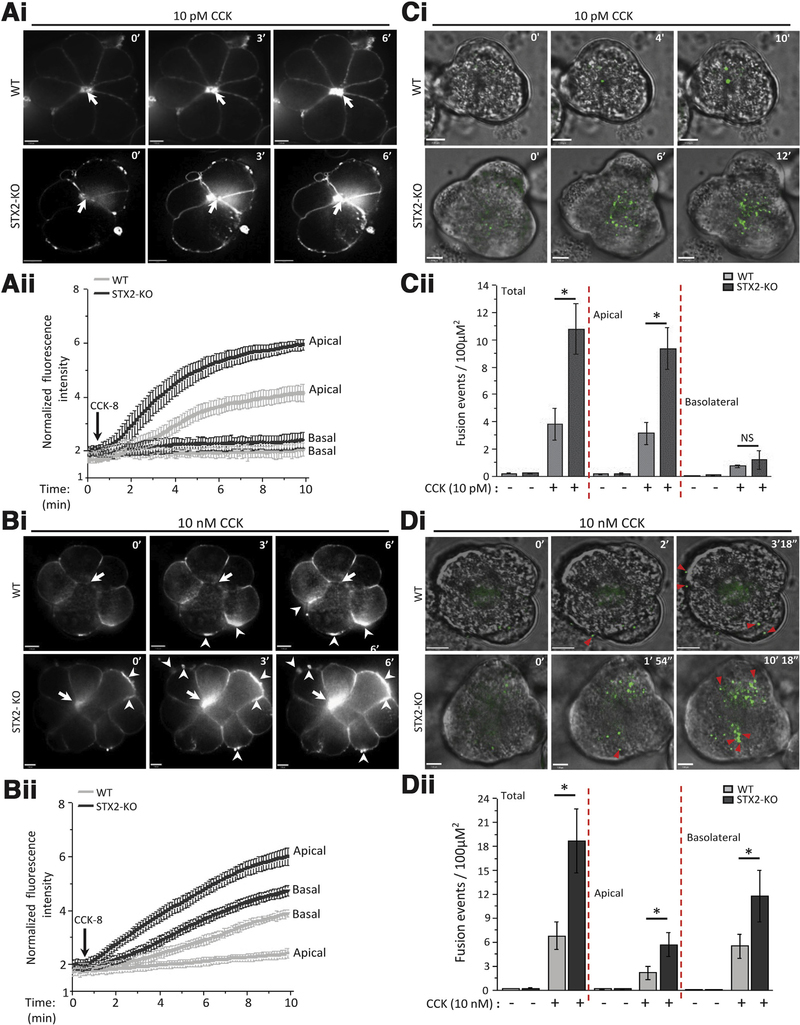
STX2 deletion augments physiologic CCK-stimulated apical exocytosis and supraphysiologic CCK-stimulated pathologic exocytosis at the basal and lateral PM. (Ai, Bi) Sequences of FM1–43 exocytosis confocal images of freshly prepared acini from WT (top) and STX2-KO (bottom) mice stimulated with (Ai) 10 pM CCK-8 or (Aii) 10 nM CCK-8. Shown are representative images at the indicated time points (scale bar = 8 μm). FM1–43 exocytotic hotspots in apical ZG poles are indicated by arrows, and hotspots in basolateral pM are indicated by arrowheads. (Aii, Bii) Graphs are analysis (Aii, 10 pM CCK-8: WT-10 acini, STX2-KO-12 acini; Bii, 10 nM CCK-8: WT-9 acini, STX2-KO-10 acini; each from 3 independent experiments) of mean real-time fluorescent tracings of the apical versus basal PM normalized to basal intensity (before stimulation). (Ci, Di) Sequences (at indicated time points) of Ad-syncollin-pHluorin-transduced acini from WT (top) and STX2-KO (bottom) mice stimulated with (Ci) 10 pM CCK-8 or (Di) 10 nM CCK-8. Shown are representative images at indicated time points (clearer larger images in Supplementary Figure 3) and in real-time in movies (10 pM CCK-8: WT, Movie 1; STX2-KO, Movie 2; 10 nM CCK-8: WT, Movie 3; STX2-KO, Movie 4). Exocytosis toward lateral and basal PM is indicated by red triangles. (Cii, Dii). Graphs showing quantitative analysis (Cii, 10 pM CCK-8: WT-14 acini, STX2-KO-15 acini; Dii, 10 nM CCK-8: WT-12 acini, STX2-KO-16 acini; each from 5 independent experiments) of the fusion events at the apical and basolateral areas, and when combined as total. Apical and basolateral areas were divided by drawing 2 concentric circles centered on the apical lumen of each image where inner circle encompasses two-thirds of the area of the outer circle, and designated as “apical area.” Fusion events outside the apical area are considered “basolateral.”22,29,53

