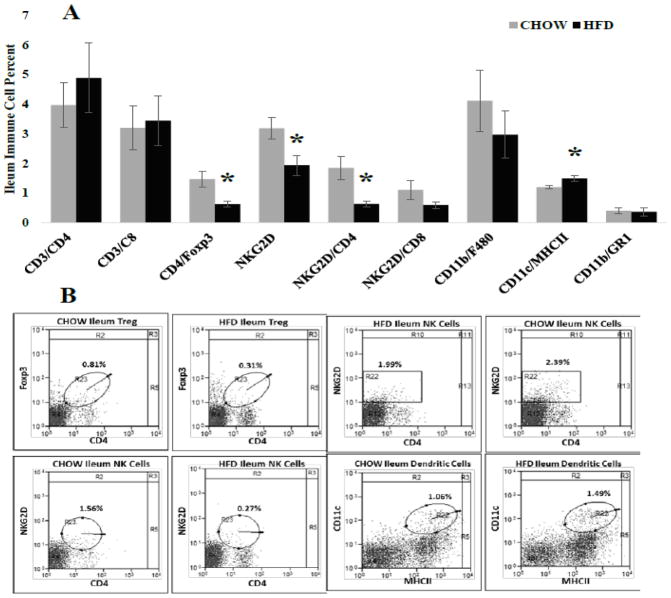
Figure 3. Immune cell frequency (%) for specific populations within the ileum.
A.) CD4+FoxP3+ regulatory T (* = 0.011), NKG2D+ (* = 0.002) and NKG2D+CD4+ (* = 0.014) immune cells were significantly decreased in HFD fed mice compared with CHOW, whereas CD11c+MHCII+dendritic cells (* = 0.014) were significantly increased. B.) Representative scatter plots of immune cell frequency for populations significantly altered by HFD. Circles indicate double positive populations while the square represents all cells positive for a single marker, NKG2D.

