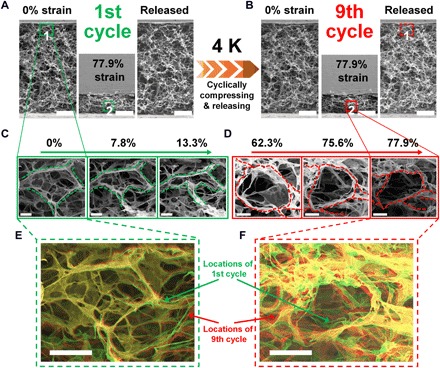
Fig. 3. In situ SEM observations of reversible compressive elasticity of the 3DGraphene foam at 4 K.

(A and B) Totally reversible deformation of the microstructure for the first (A) and ninth (B) compress-release cycles. (C and D) Magnifications of the marked zones with increasing compressive strains, demonstrating deformations of the graphene sheets during compression. (E and F) Overlaps of marked zone 1 with 0% strain in the first and ninth compress-release cycles (E) and of marked zone 2 with 77.9% strains in the first and ninth compress-release cycles (F), and the images of the first and ninth cycles are digitally processed with green and red colors, respectively. Scale bars, 100 μm (A and B), 10 μm (C and D), and 20 μm (E and F).
