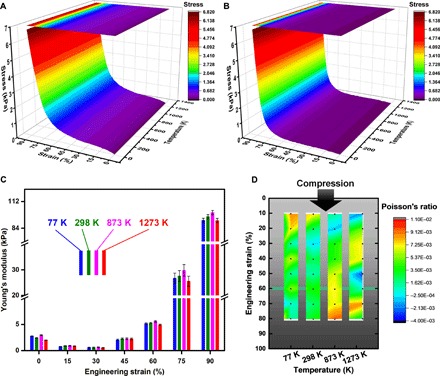
Fig. 4. Temperature invariance of the mechanical properties of the 3DGraphene foam.

(A and B) 3D surface graphs of the stress dependence on strain and temperature in the compression (A) and release (B) processes of the 3DGraphene foam, both exhibiting clear temperature invariance from 4 to 1273 K. (C and D) Grouped column graph (C) of Young’s modulus and intensity map graph of Poisson’s ratios (D) at a series of engineering strains measured at different temperatures, showing excellent temperature invariance of both Young’s modulus and near-zero Poisson’s ratio. Error bars represent SDs for the repeated measurements.
