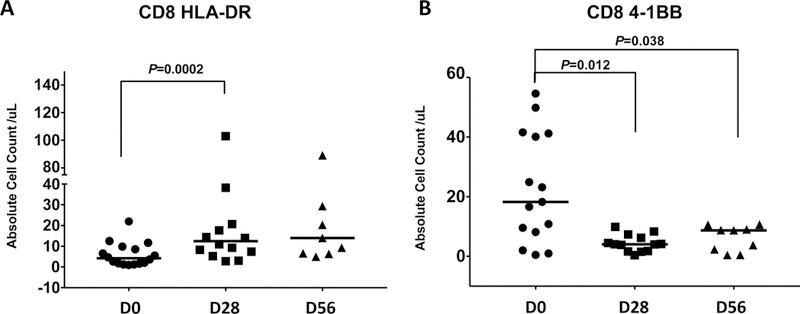
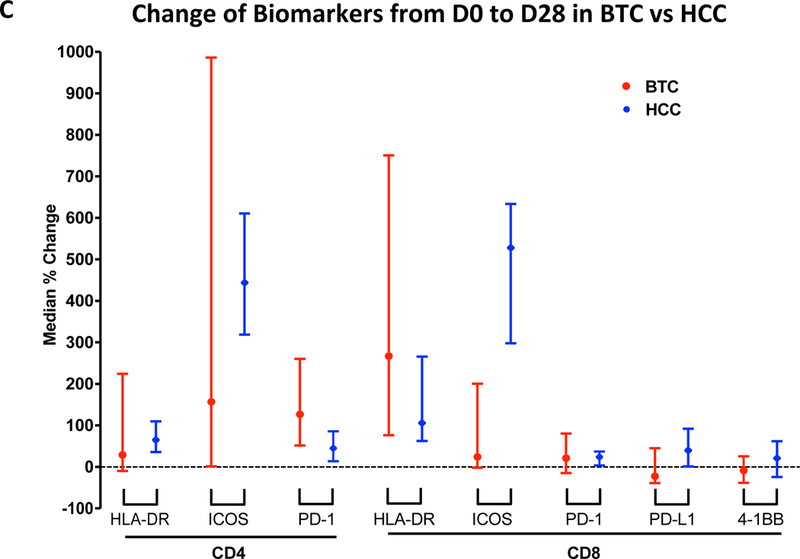
Figure 3: Immune cell profiling determined by flow cytometry.


(A) Significantly increased HLA-DR positive CD8+ T cells at D28 compared with D0 (P=0.0002) as well as D56 compared with D0 (P=0.046). Horizon line represented median. (B) Suppressed 4–1BB–positive CD8 T cell count after the treatment (P=0.012 and P=0.038). Horizon line represented median. (C) Comparison of the change of immune cell profiling between BTC and HCC cohort treated with CTLA-4 blockade and microawave ablation. Bar represented upper and lower limit of cell count of individual subset and dot symbol as mean.
