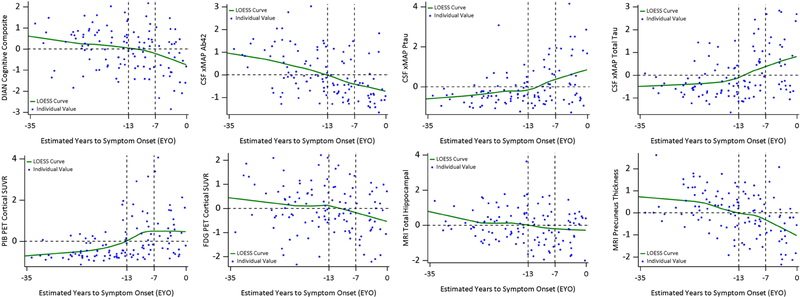
Figure 2:
Individual values and LOESS curves over EYO for mutation carriers. All outcomes were standardized for ease of comparison using the mean (SD) of the whole cohort and to avoid unblinding mutation status. EYO −13 and −7 separated the preclinical phase into three stages. The y-axis reference line 0 represented the group mean. PiB PET exhibited a clear plateau around EYO −7 years and FDG PET started a decline around EYO −13 years. All the outcomes crossed the horizontal line of 0 (the mean of the entire cohort after normalization) at the transitioning EYO stage (−13, −7].

