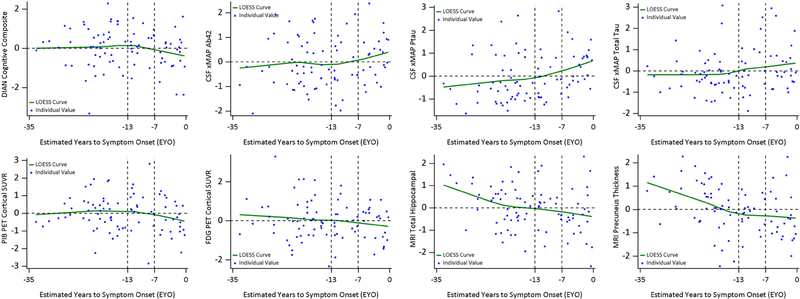
Figure 4:
Individual values and LOESS curves over EYO for mutation non-carriers (NCs). All outcomes were standardized for ease of comparison using the mean (SD) of the whole cohort and to avoid unblinding mutation status. EYO −13 and −7 did not separate the preclinical phase into three stages based on NCs. The y-axis reference line 0 represented the group mean. NCs did not show a consistent transitioning pattern across the entire EYO, particularly for PiB PET and FDG PET

