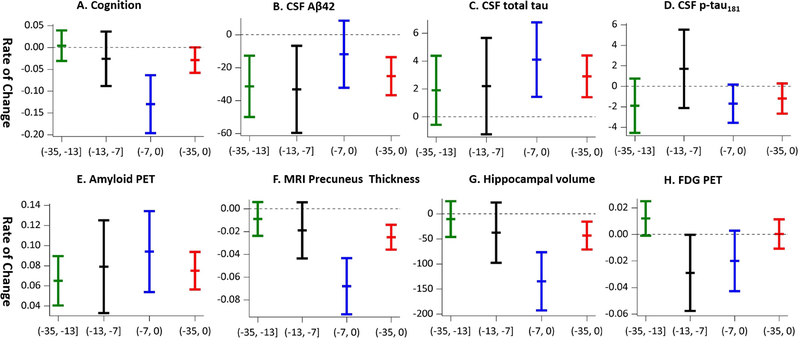
Figure 5:
The rate of change for each outcome for mutation carriers by disease stages and for the overall preclinical stage. Each vertical line includes three tickers for the mean and 95% confidence interval. If the vertical line covers the 0 on the y-axis, the rate of change is not significant. Only amyloid PET has significant rate of change over all three stages (thus the reference line is not shown).

