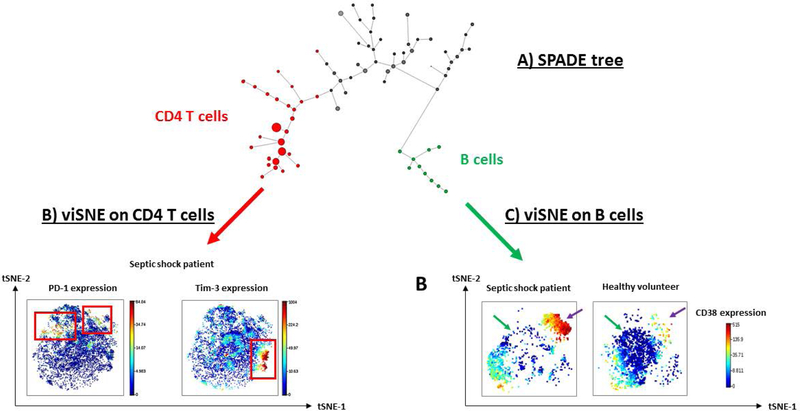
Figure 3. Illustrative example of unsupervised analysis of CyTOF results in healthy volunteers and septic patients.
These results have been obtained from reference (70) (A) SPADE clustering analysis was performed in order to group peripheral blood mononuclear cell sub-populations into “nodes” according to phenotype similarities. These nodes and their relationships are represented in a minimum spanning tree format (i.e. SPADE tree). Size of the nodes illustrates the number of cells within the clusters. In this analysis, CD4 expressing cells are highlighted as red nodes while CD19 expressing cells are represented as green nodes. (B) viSNE visualization tool was then performed on selected CD4+ cells from SPADE nodes. Based on the t-Distributed Stochastic Neighbor Embedding (t-SNE) algorithm, viSNE determines the two dimensional representation of single-cell data sets that best matches their respective local and global geometry. Cells get unique x- and y-coordinates (tSNE1 and tSNE2) according to their expression of parameters from CyTOF panel. Their relative positions on the two-dimensional plot indicate similarities in terms of expression pattern. In the current analysis, we used color as a third dimension to visualize specific marker expression levels (PD-1 and Tim-3) in one representative example of a septic patient. Red and blue color intensities respectively represent high and low expression levels of the indicated marker. In this illustrative septic shock patient, PD-1 and Tim-3 are clearly not co-expressed by same CD4 T cell subpopulations (red squares). (C) Alternatively, viSNE algorithm was performed on selected CD19+ B cells to compare sepsis vs healthy volunteers. Expression level of CD38, a marker of B cell maturation was visualized on the viSNE plots in one representative septic shock patient and one healthy donor. A depletion of cells from the center of the map (green arrows), but an enrichment within the upper right cell cluster (purple arrows) are noticed in the patient. This latter cluster was constituted of CD38hi cells, suggesting a shift towards differentiated B cells in septic shock patients.

