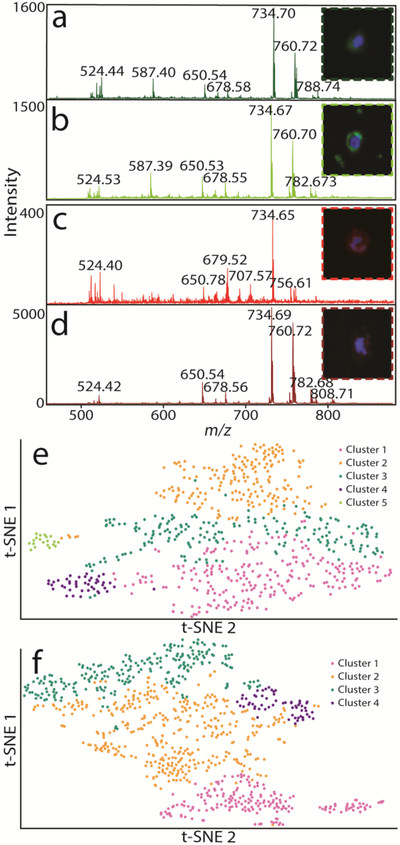
Figure 3.
High-quality single cell mass spectra and ICC images are acquired and compared for over a thousand individual cells. Single cell spectra for cells displayed in each panel are shown. (a) Single cell spectrum for an NF-L-positive cell. (b) A second NF-L positive cell with similar mass spectral features. (c) GFAP-positive single cell that is visibly different from the (d) second chosen GFAP-positive cell. Green and red fluorescence corresponds to NF-L and GFAP, respectively, while blue fluorecsence corresponds to a nuclear dye.(e) t-SNE plot of NF-L-positive cells are colored to correspond to the five clusters determined by HCA. (f) t-SNE plot of GFAP-positive cells colored to correspond to the four clusters determined by HCA.

