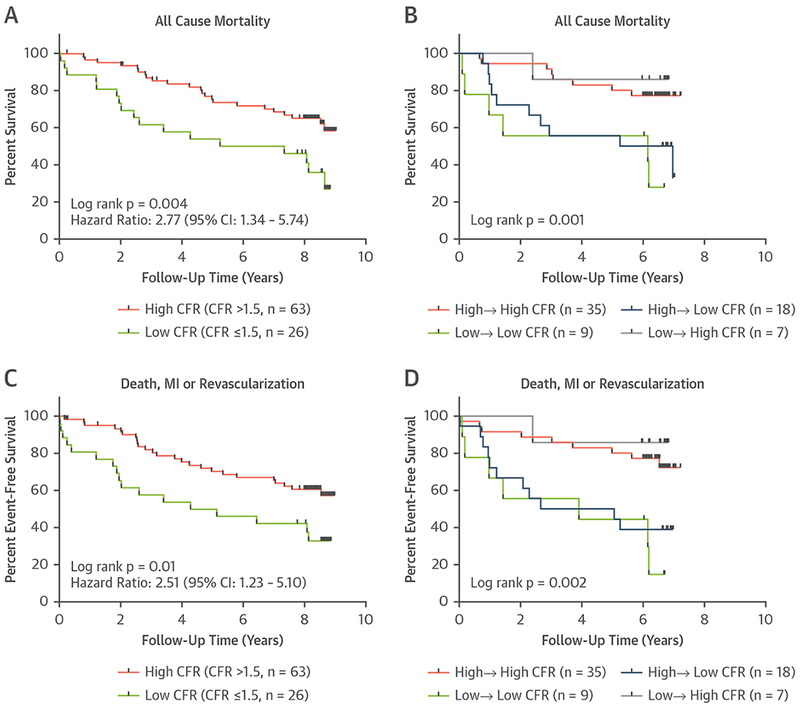
FIGURE 6. Mortality and Composite Outcomes.

Kaplan-Meier plots for cumulative survival in the entire cohort based on baseline PET-1 CFR (A) and in patients with available follow-up imaging based on PET-1 and PET-2 CFR values (B). High → high represents patients with CFR >1.5 at both PET-1 and PET-2. Low → high CFR represents patients with CFR ≤1.5 at PET-1 and CFR >1.5 at PET-2. Low → low CFR represents patients with CFR ≤1.5 at both PET-1 and PET-2. High → low represents patients with CFR >1.5 at PET-1 and CFR ≤1.5 at PET-2. (C, D) Similar Kaplan-Meier plots are presented for the combined endpoints of death, myocardial infarction (MI), and revascularization. CI = confidence interval, other abbreviations as in Figures 2 and 5.
