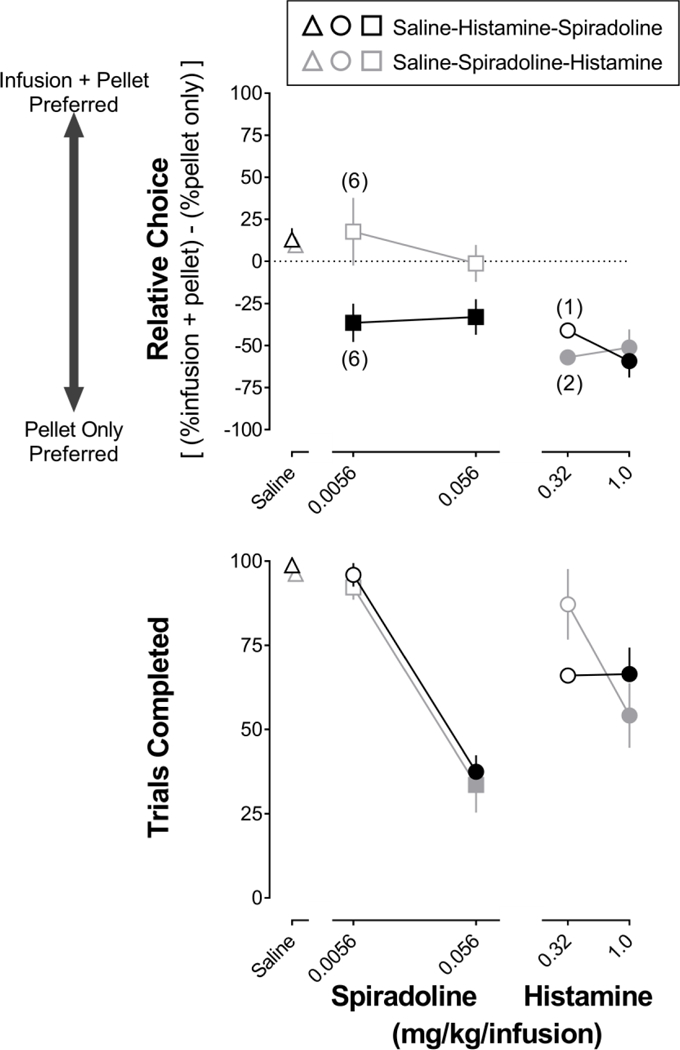
Figure 3.

Mean (±1 SEM) relative choice for each alternative (upper) and the number of trials completed (lower) during saline (triangles), histamine (circles), and spiradoline (squares) tests in Experiment 2. Black outlined symbols represent 8 rats that were tested with histamine prior to spiradoline. Gray outlined symbols represent 8 rats that were tested with spiradoline prior to histamine. Filled symbols denote a significant (p<0.05) effect compared with saline. Each data point represents 8 rats, except where noted by numbers in parentheses. Horizontal axes: unit dose in mg/kg/infusion.
