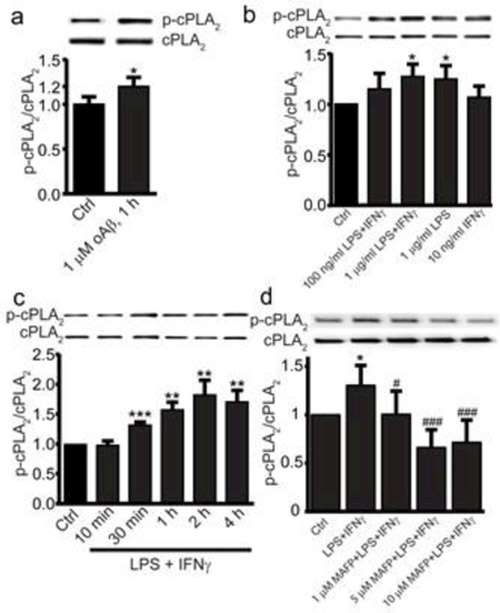
Fig. 2.
CPLA2 activation in BV2 cells. Cells were treated with (a) 1 μM oAβ42 for 1 h, (b) LPS and/or IFNγ (10 ng/ml in all cases except control) for 1 h and (c) 1 μg/mL LPS and 10 ng/mL IFNγ from 0-4 h. (d) BV2 cells were pretreated with 0, 1, 5 or 10 μM MAFP for 30 min, then all groups were treated with LPS (1 μg/ml) + IFNγ (10 ng/ml) for 1 h. The ratio of p-cPLA2/cPLA2 is represented as the fraction percentage of the control group. Data are shown as mean ± SD from 3-4 independent experiments (n = 3 or 4), at least 6 independent experiments for (d) (n ≥ 6). *P < 0.05, **P < 0.01, ***p < 0.001, compared with the control group; # P < 0.05, ### P < 0.001 compared with the LPS + IFNγ group in (d).

