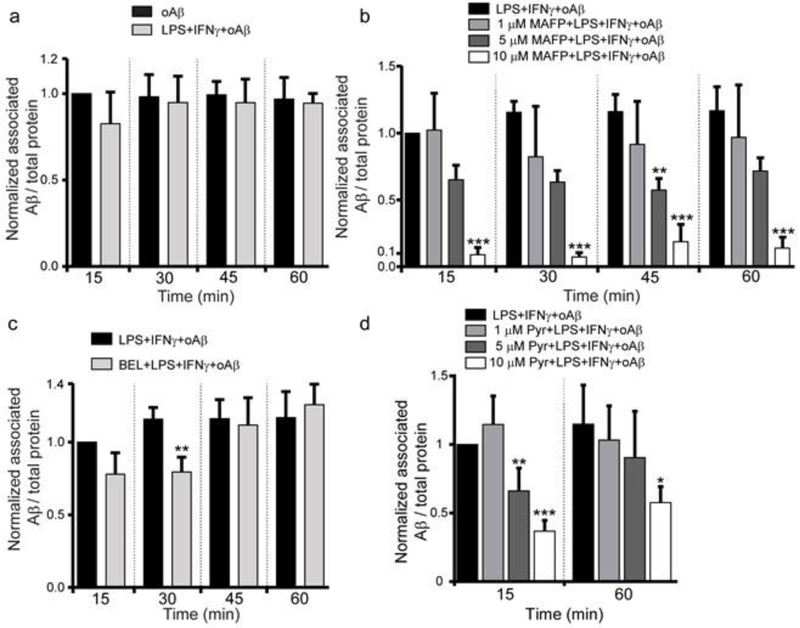
Fig. 3.
Effect of CPLA2 inhibition on Aβ association with BV2 cells. (a) Quantification of associated Aβ in BV2 cells pre-treated with LPS + IFNγ using ELISA assay. Cells were treated with or without LPS (1 μg/ml) + IFNγ (10 ng/ml) for 1 h, followed by 1 μM oAβ42 treatment for 15, 30, 45 and 60 min. Data are represented as the ratio of Aβ42 to total protein, and normalized by the oAβ group at 15 min. Data are shown as mean ± SD from 3 independent experiments (n = 3). No significant difference was observed between these two groups at any time point. (b) Quantification of associated Aβ in BV2 cells pre-treated with MAFP using ELISA assay. Cells were pretreated without or with MAFP (1 μM, 5 μM and 10 μM) for 30 min, followed by 1 μg/ml LPS +10 ng/ml IFNγ treatment for 1 h, then cells were incubated with 1 μM oAβ for 15, 30, 45 and 60 min. Data are represented as the ratio of Aβ to total protein, and normalized by the LPS + IFNγ + oAβ group at 15 min. Data are shown as mean ± SD from 3 independent experiments (n = 3). **P < 0.01, ***P < 0.001 compared with the LPS + IFNγ + oAβ group at the corresponding time. (c) Quantification of associated Aβ in BV2 cells pre-treated with BEL using ELISA assay. Cells were pretreated without or with 2 μM BEL for 30 min, followed by 1 μg/ml LPS +10 ng/ml IFNγ treatment for 1 h, then cells were incubated with 1 μM oAβ for 15, 30, 45 and 60 min. Data is represented as the ratio of Aβ to total protein, and normalized by the LPS + IFNγ + oAβ group at 15 min. Data are shown as mean ± SD from 3 independent experiments (n = 3). ** P < 0.01 compared with the LPS + IFNγ + oAβ group at the corresponding time. (d) Quantification of associated Aβ in BV2 cells pre-treated with Pyr using ELISA assay. Cells were pretreated without or with Pyr (1 μM, 5 μM and 10 μM) for 30 min, followed by 1 μg/ml LPS + 10 ng/ml IFNγ treatment for 1 h, then cells were incubated with 1 μM oAβ for 15 and 60 min. Data is represented as the ratio of Aβ to total protein, and normalized by the LPS + IFNγ + oAβ group at 15 min. Data are shown as mean ± SD from 3 independent experiments (n = 3). *P<0.05, **P < 0.01, ***P < 0.001 compared with the LPS + IFNγ + oAβ group at the corresponding time.

