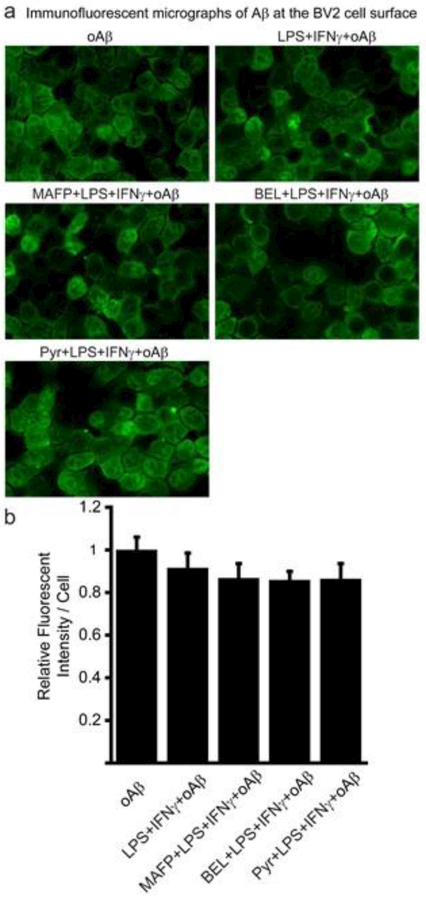
Fig. 4.
Aβ association with BV2 cells surface. Cells were pretreated with or without 10 μM MAFP or Pyr or 2 μM BEL for 30 min and treated with 1 μg/ml LPS + 10 ng/ml IFNγ for 1 h, followed by incubation with 1 μM oAβ for 15 min. Fluorescent intensities per cell were normalized by the oAβ group. Data are shown as mean ± SD from 3 independent experiments (n = 3) (at least 12 images were analyzed for each group per experiment). * P < 0.05 compared with the LPS + IFNγ + oAβ group. (a) Representative immunofluorescent images of Aβ association with BV2 cell surface. Aβ was stained with Alexa Fluor 488-6E10 antibody without cell permeabilization. (b) Quantification of immunofluorescent images of Aβ association with BV2 cell surface. MAFP and Pyr did not impose any effect on Aβ association with BV2 cell surface.

