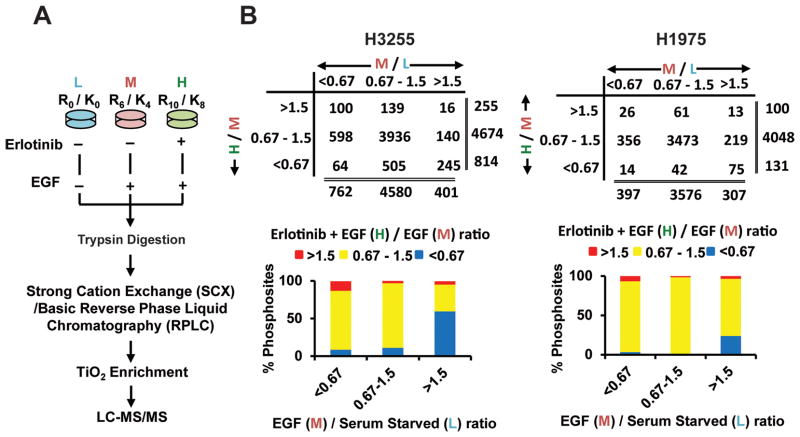
Figure 1.
SILAC-based quantitative mass spectrometry and phosphopeptides identified in groups of specific SILAC ratios. A. Flowchart showing biological treatment of SILAC-labelled cells, enrichment of phosphopeptides, and detection by tandem mass spectrometry. B. Number of class I phosphosites (localization probability >0.75) identified with SILAC ratios >1.5 (increased), 0.67–1.5 (unchanged) and <0.67 (decreased) (upper panel) and percentage of phosphosites in each of those groups (lower panel) in H3255 (left panel) and H1975 (right panel) cells. Ratio M/L is EGF/Serum starved and ratio H/M is erlotinib + EGF / EGF states.

