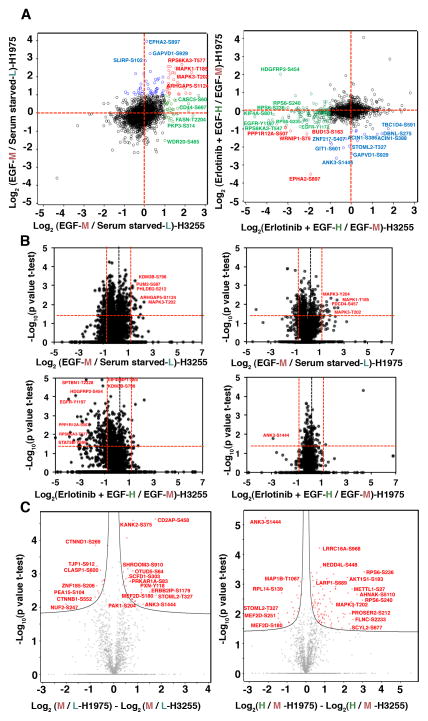
Figure 2.
Distribution of quantified class I phosphosites and volcano plots showing significant SILAC ratios of phosphopeptides in H3255 and H1975. (A) Scatter plot showing distribution of SILAC ratios of EGF stimulation or erlotinib inhibition. Left panel is a plot against the Log 2 base ratio of EGF stimulated and serum starved cells (M/L). Right panel is a plot against the Log 2 base ratio of erlotinib inhibited before EGF stimulation and EGF stimulated cells (H/M). Each circle is a phosphorylation site. Annotated circles represent specific phosphosites with 2 fold-changes. The phosphosites that change in both H3255 and H1975, H3255 only, H1975 only are depicted in red, green, and blue circles, respectively; unaltered phosphosites between H3255 and H1975 are depicted in black. (B) Volcano plots showing significant SILAC ratios (M/L-upper panel; H/M-lower panel) of phosphosites that show hyperphosphorylation, no change or dephosphorylation with EGF and erlotinib treatment. Log2 ratios of the median of biological replicates were plotted versus −log10 of the p-values derived from a t-test. Proteins with a minimum 2-fold change combined with a p<0.05 are considered significant (red lines). Left panels are the changes in H3255; and right panels are the changes in H1975. Paired t-test was used for significance analysis from five biological replicates for H3255 and three biological replicates of H1975. (C) Volcano plots representing significant alterations of phosphorylation changes upon EGF stimulation or TKI inhibition between H3255 and H1975 cells. Differences in log2 ratios of M/L (left panel) and H/M (right panel) of H1975 and H3255 were plotted against −log10 of the p-values derived from a t-test. Hyperbolic curves separate the phosphosites significantly different between the two cell lines (red circles) from the ones unaltered between the two cell lines (grey circles).

