Fig. 3.
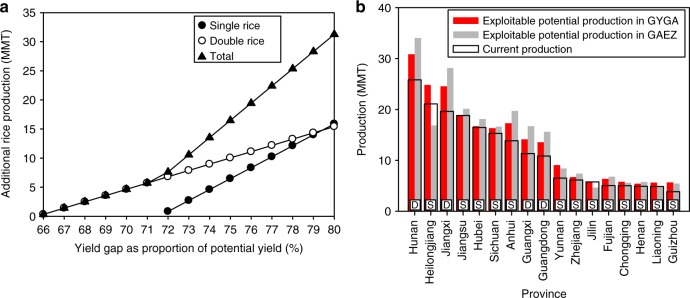
Rice production in different cropping systems and provinces. a Additional rice production resulting from yield gap closure (expressed as % of potential yield) in single- and double-rice systems assuming no change in harvested area for each system and a maximum exploitable yield ceiling that is 80% of potential yield. b Current annual rice production and exploitable potential production for each major rice-growing province as estimated using protocols developed by the Global Yield Gap Atlas (GYGA) or by the Global Agro-Ecological Zones Model version 3.0 (GAEZ v3.0). Capital letters at bottom of each province production bar designate provinces in which double- (D) or single-rice (S) dominate. Exploitable potential production for each province is calculated as the product of provincial average rice planting area of 2013–2015 and the exploitable yield whereby all rice farmers achieve yields that are 80% of potential yield. The current production for each province is based on 2013–2015 average. MMT million metric tons. Source data are provided as a Source Data file

