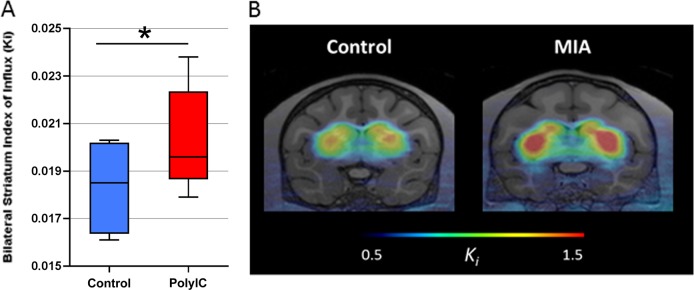
Fig. 1. [18F]FMT index of influx in MIA-treated compared to control offspring.
a Weighted least squares regression revealed that significantly higher [18F]FMT index of influx in MIA compared to control animals (F1,11 = 10.98, p = 0.007). b PET SUV images showing the striatal uptake of [18F]FMT. [18F]FMT PET images overlaid on anatomical MR images and are scaled to the same lower (0.5) and upper thresholds (1.5) as depicted in the color bar

