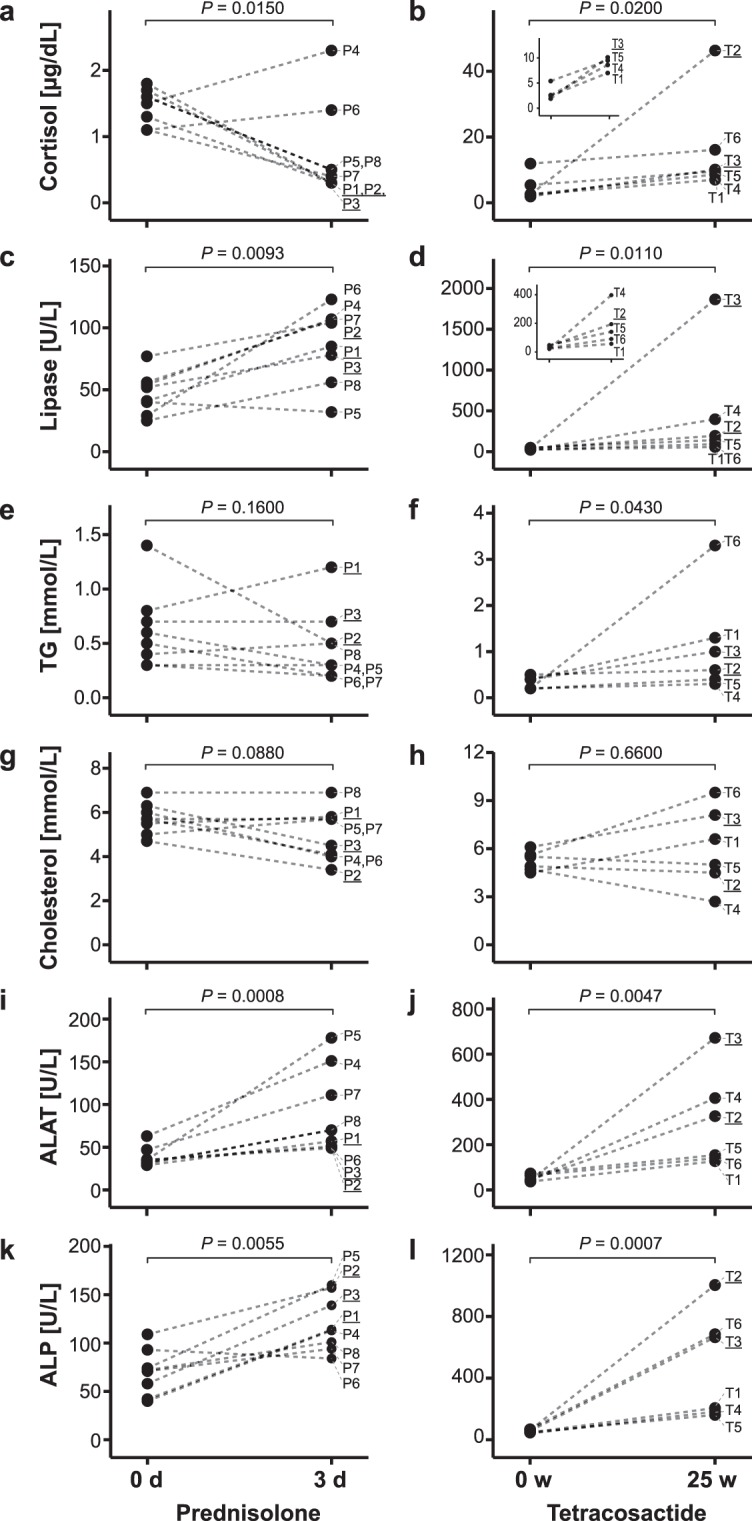
Figure 1.

Changes in clinical plasma markers of lipid metabolism. Levels for each dog before (0 d and 0 w, respectively) and after (3 d and 25 w, respectively) treatment with short-term prednisolone (left) or long-term tetracosactide (right). Values from the same dog, before and after treatment, are connected with dotted lines. The P values of paired two-tailed t tests comparing log-transformed values before and after treatment are indicated at the top of each panel. Small inserts illustrate data at a magnified scale. ALAT, alanine aminotransferase activity; ALP alkaline phosphatase activity; TG triglycerides.
