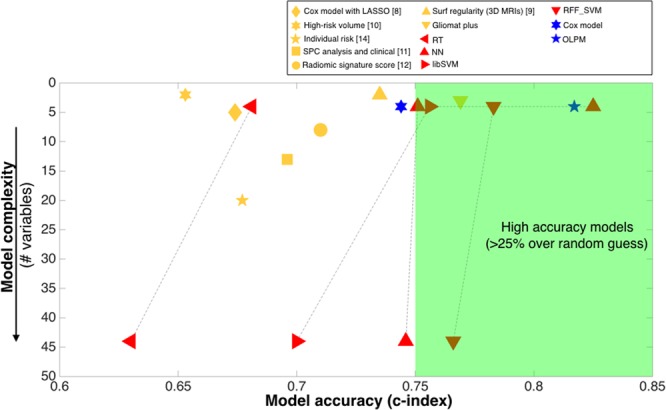
Figure 2.

Comparison of the predictive value (c-index) and number of variables for the models developed in this paper versus representative models from the literature. Previous approaches are shown in yellow, with different symbols corresponding to different studies. ML methods described in this paper are shown in red and linear models in blue. Results are given for the best models in each reference and for the validation groups when available.
