Fig. 2.
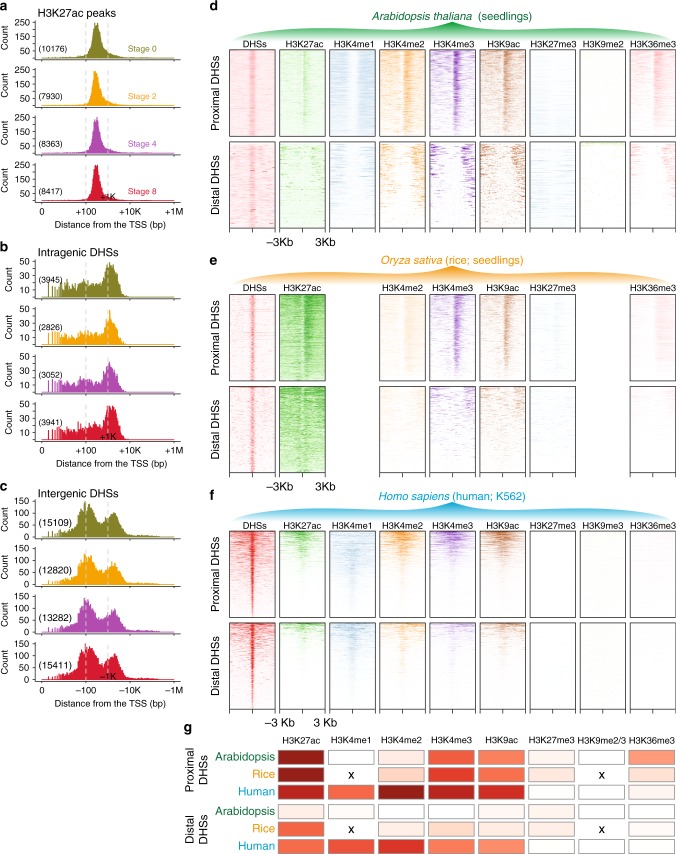
H3K27ac preferentially appears in promoter regions but not in enhancers in Arabidopsis. a Distribution of the distance of H3K27ac peak summits from the transcription start site (TSS). Only intragenic H3K27ac peaks were used in the analysis. b, c Distribution of the distance of the center of DNase I hypersensitive sites (DHSs) from the TSS. Intragenic DHSs are downstream of the TSS (b), while intergenic DHSs are upstream of the TSS (c). a–c The number of H3K27ac peaks or DHSs is shown in parentheses. Note that the distance for intragenic peaks is presented as positive (+) values, while the distance for intergenic peaks is shown as minus (–). The x axis is log10-transformed. d–f Various histone modification ChIP intensities relative to the peak centers of proximal and distal DHSs. ChIP-seq and DNase-seq data were generated from Arabidopsis seedlings (d), rice seedlings (e), and human K562 cell line (f). Note that there is no H3K36me3 enrichment at the gene body at the proximal DHSs in the human cell line. This is in contrast to other reports in mammals (e.g., ref. 81), possibly due to differences in H3K36me3 antibody quality. g Relative enrichment of selected histone modifications in proximal and distal DHSs, respectively. The heatmap shows the Jaccard statistic between the intervals of DHSs and histone-modified sites. “x” denotes the missing matched histone modification datasets in rice. High values are shown in red and low values in white. The underlying source data for a, b, and g are provided in the Source Data file

