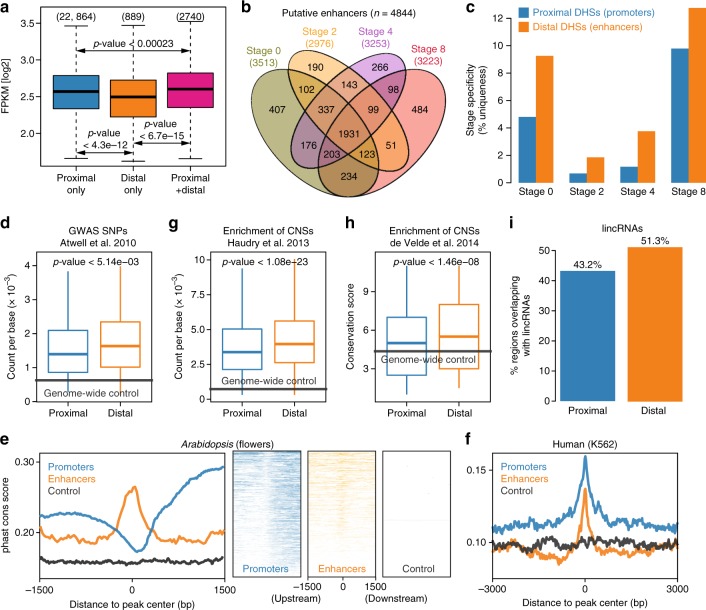
Fig. 3.
Identifying and characterizing intergenic DHS-based enhancers. a Boxplots of gene expression for H3K27ac-marked genes associated with only proximal DNase I hypersensitive sites (DHSs), with only distal DHSs, or with both. P-values were calculated based on Wilcoxon signed-rank tests. The number of genes in each category is shown in parentheses. b Venn diagram representing the overlap of putative enhancers identified in different stages. c Bar chart showing the stage specificity, i.e., the called DHSs only existed at one specific stage, of promoters and distal enhancers. d Enrichment of significant associations for flowering-related phenotypes from a genome-wide association study (GWAS)37. The y axis shows the number of significant SNPs per basepair. e Distribution of phastCons score around the peak centers of promoter (blue) and enhancer (orange) DHSs in Arabidopsis. The distribution of phastCons score for promoter and enhancer DHSs was plotted in a strand-specific manner, using the orientation of their target genes. As a control, 10,000 random intergenic non-DHS regions were used to calculate the distribution of phastCons score (gray). PhastCons scores between Arabidopsis and other crucifers were taken from ref. 38 for Arabidopsis (nine-way multiple alignment). Left panel, composite (average intensity) plots; right panel, heatmaps of conservation distribution per DHS. f Similar to e (left panel), conversation analysis of human promoter and enhancer DHSs in the K562 cell line. PhastCons scores for humans were taken from the UCSC genome browser (100-way multiple alignment). g Enrichment of conserved noncoding sequences (CNSs) in promoters and enhancers. The y axis shows the number of CNSs per basepair. Data from ref. 38. h Similar to g, the y axis shows the conservation score. Data from ref. 40. a, d, g, h Boxplots show the median (horizontal line), second to third quartiles (box), and Tukey-style whiskers (beyond the box). d–h Genome-wide average values were used for control (gray lines). P-values measure statistical significance based on a Welch’s t test. i Percentage of promoters and enhancers overlapping with lincRNA loci. Annotation of lincRNAs were obtained from refs. 41, 42. The underlying source data for a, c, d, and g–i are provided in the Source Data file

